
How the Typical U.S. Household Spends Monthly
The typical U.S. household had pre-tax earnings of $78,635 with $67,241 after-tax income in 2018 as reported by the U.S. Bureau of Labor Statistics (BLS). The BLS tracks not only employment and income, but also how the typical household spends that money. With an average 2018 monthly spend of $5,201 per household and an average 2.5 people per household, per-person spending came in at $2,080.
Housing accounts for $1 out of every $3 spent, transportation $1 out of every $6 and food $1 out of every $8 including groceries and meals away from home.
The following table shows how much each household spent monthly as of 2018 – the latest data available from the BLS until September 2020.
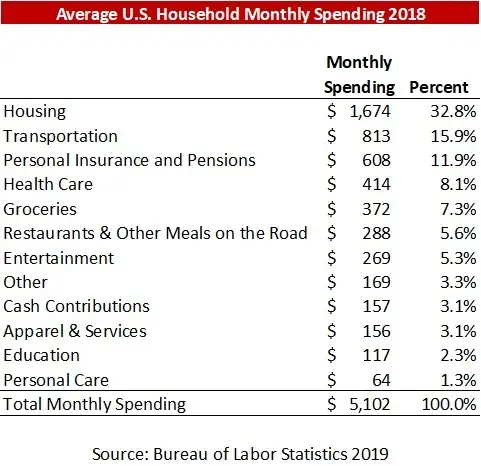
The level of resolution reported by the BLS is impressive as is the breadth of information, spanning from the estimated average home value ($198,612), to annual per-capita spending on fireworks ($1.43). Each household (pre-Coronavirus) spent $501 annually on airfare. To read the entire list of typical monthly spending click https://www.bls.gov/cex/2018/research/allcuprepub.pdf
To read the full Motely Fool-The Ascent study findings referenced in USA Today click https://www.usatoday.com/story/money/2020/05/11/how-does-your-household-spending-compare-with-the-average/111676878/
All of this has changed given the pandemic today, but it does give a baseline to measure future changes. No doubt many Americans still employed have added more to savings since mid-March this year than any two-month period in their lives as they have remained home. Yet unknown is how long habits developed under the pandemic will remain or the speed at which we return to our former spending habits.
Ted