Most At-Risk Metros for Unemployment Due to Leisure & Hospitality Employment - Coronavirus Impact
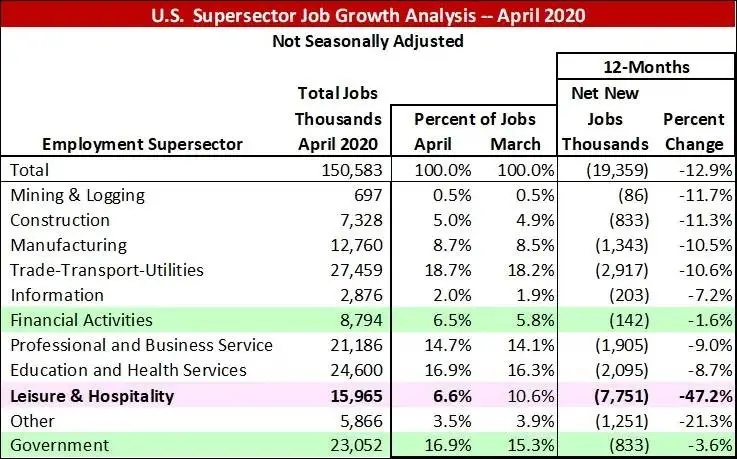
The blaring, flashing, neon-bright, bad-news statistic in the U.S. April jobs report was the loss of one-in-every-two jobs (47.2 percent) in the Leisure & Hospitality segment in the prior 12 months, as reported by the Bureau of Labor Statistics (BLS). Job losses in each of the SuperSegments (as defined by the BLS) are shown in the following table (with a full summary available in the prior Stewart Blog at April 2020 Jobs Report – Ugliest in Our Lives with More to Come). April job losses accounted for almost all of the decline in the past 12 months, making up 46.8 percent of total loss in Leisure & Hospitality jobs alone.
The major Leisure & Hospitality job segments include (defined by the North American Industry Classification System):
Leisure and Hospitality
- Arts, Entertainment, and Recreation
- Performing Arts, Spectator Sports, and Related Industries
- Museums, Historical Sites, and Similar Institutions
- Amusement, Gambling, and Recreation Industries
- Accommodation and Food Services
- Accommodation
- Food Services and Drinking Places
Those metros with greater percentages of Leisure & Hospitality jobs will likely have the largest comparative loss of jobs due to Coronavirus. The prevalence of Leisure & Hospitality (L&H) jobs varies significantly across U.S. metros and also within some markets depending on seasonality. As usual, I invoke the TINSTAANREM axiom — There Is No Such Thing As A National Real Estate Market. Ditto the number and percentage of L&H jobs across metros and, for some, by month.
To identify the most-at-risk metros for job losses, an analysis of Leisure & Hospitality employment was completed using the BLS non-seasonally adjusted L&H job numbers and respective percentages of total jobs. While the U.S. and state employment data are available on both a seasonally adjusted and non-seasonally adjusted basis, employment statistics at the metro level are only reported on a non-seasonally adjusted level.
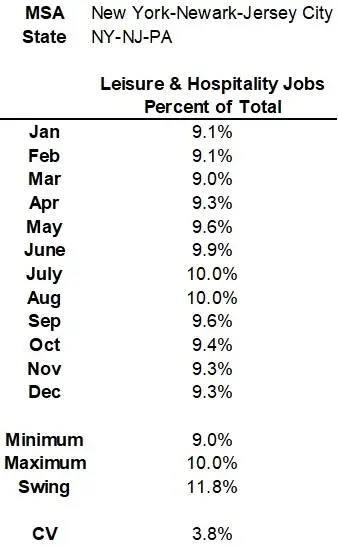
The following data were analyzed and metrics calculated for each individual Metropolitan Statistical Area (MSA) and Division for which data are reported by the BLS. For illustration purposes, the New York–Newark–Jersey City MSA data are shown below (the most populous MSA in the country with the greatest number of jobs). Specific details for each metric:
- The monthly percentage of L&H jobs is calculated by dividing the number of L&H jobs by the total number of jobs for each month.
- Number of jobs are non-seasonally adjusted, reported by the BLS as thousands.
- January–March jobs are based on 2020 data; April–December use 2019 data — representing the latest 12 months of information.
The impact of seasonal tourism can be seen by month, with L&H employment as a percentage of total jobs greatest in June–July–August and least in January–February–March for the New York–Newark–Jersey City MSA. The lowest month of L&H jobs in the MSA as a percentage of total employment was 9.0 percent in March, peaking at 10 percent in both July and August.
Swing is defined as the percentage difference between the lowest and highest months of L&H job numbers, based on the number of jobs (in thousands).
The Coefficient of Variation (C.V.) is a standardized, unitless measure of dispersion that shows how variable or uniform a data series is. It is calculated by dividing the standard deviation by the mean of monthly L&H jobs. This statistic helps identify metros with the greatest seasonality of employment and those with the least variation. The hypothesis is that markets with the highest C.V. will likely have the greatest percentage of job losses in high season.
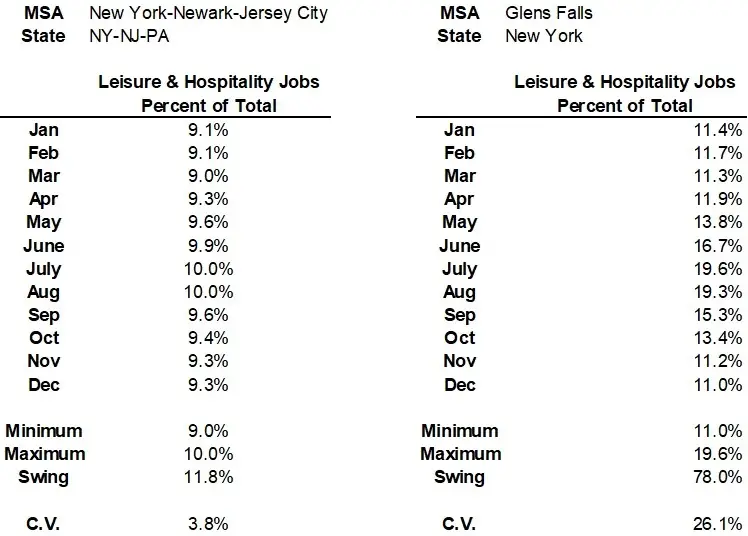
To illustrate the difference between metros with lower and higher seasonality, the following adds Glens Falls, New York statistics to the table above. While the New York–Newark–Jersey City MSA had a C.V. of 3.8 percent, Glens Falls registered a 26.1 percent C.V. due to the larger differences between June–July–August highs and November–March lows.
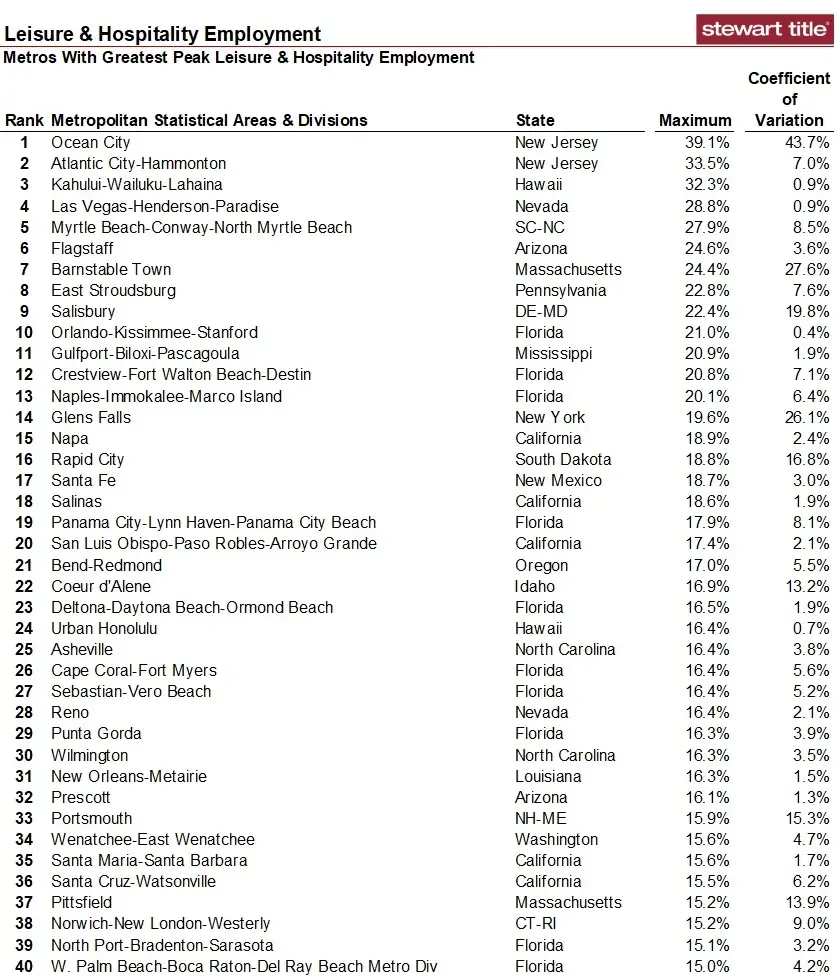
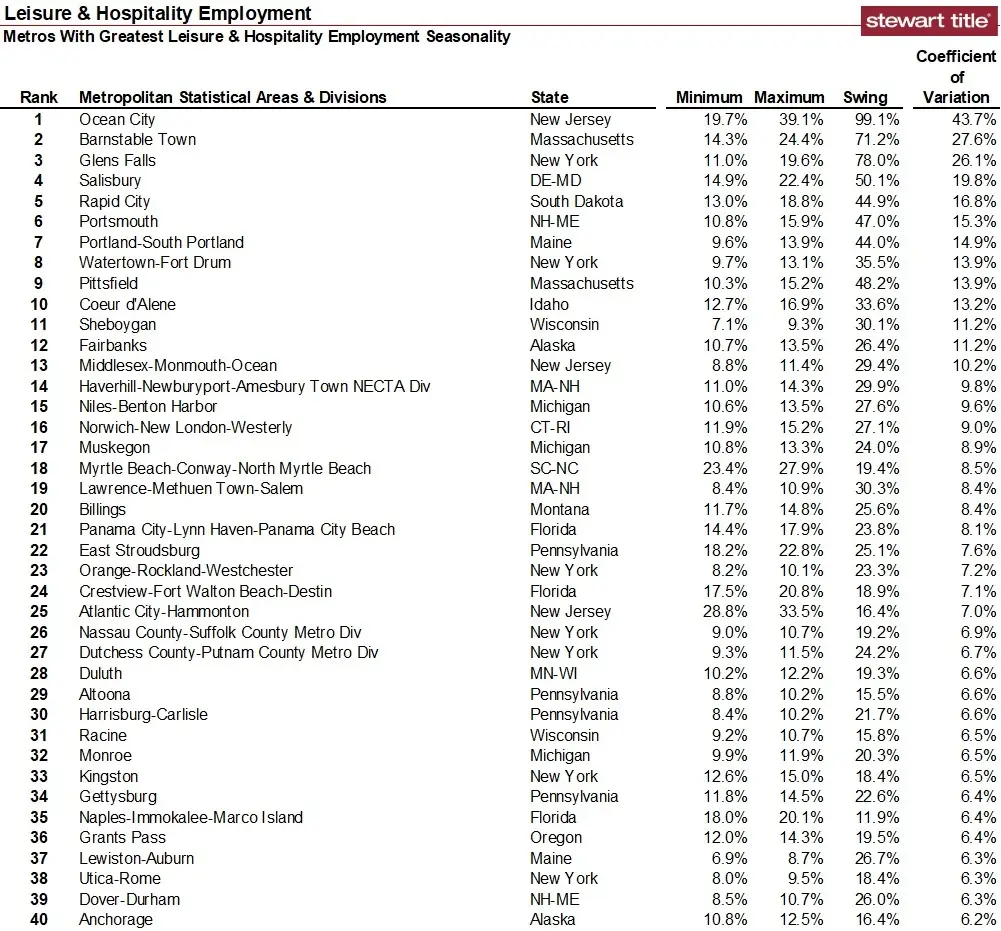
Cities with the greatest peak month percentage L&H employment are shown in the following table along with the respective C.V. statistics. The greater the C.V., the greater the seasonal change in L&H employment. Ocean City, New Jersey, had the top peak percentage of L&H employment in the country at 39.1 percent (July). The corresponding C.V. of 43.7 percent indicates significant L&H seasonality, with the job sector troughing in March at 19.7 percent. In contrast, the Las Vegas MSA ranked fourth with a 28.8 percent peak month (both June and July) but troughed only slightly lower at 27.8 percent (November and December). Across the board, these metros can be defined as tourist and/or seasonal-living destinations.
Metros with the lowest individual monthly percentage of L&H employment are shown in the next table. Sheboygan, Wisconsin, despite having a trough of 7.1 percent L&H employment, still posted a C.V. indicating a high level of seasonality.
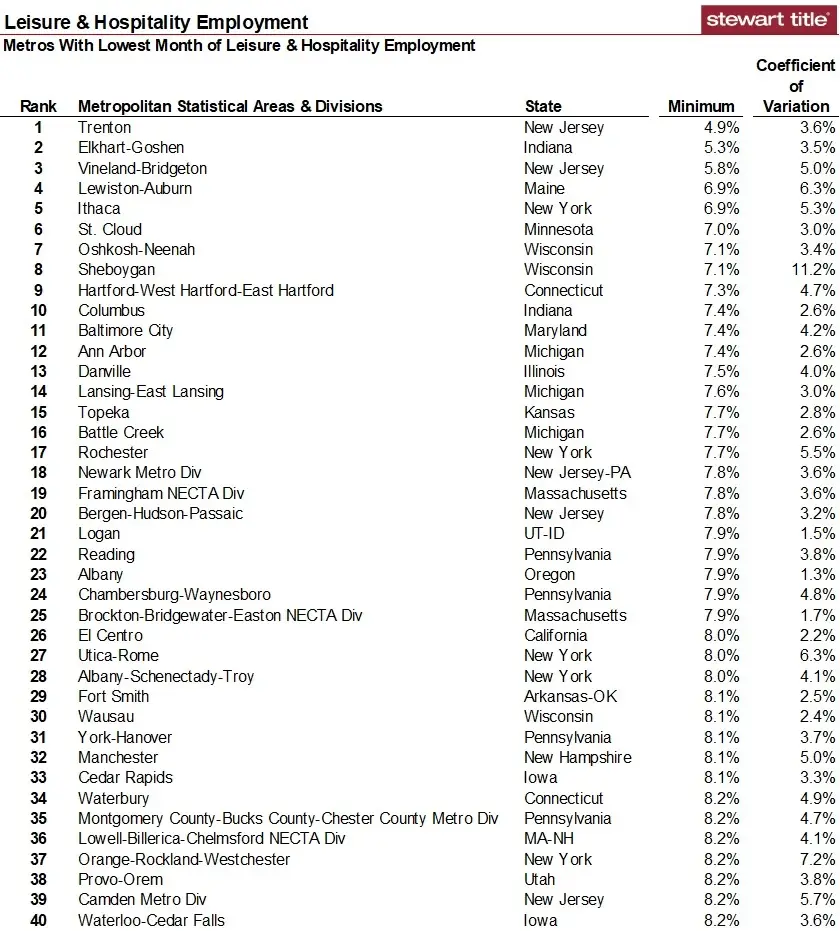
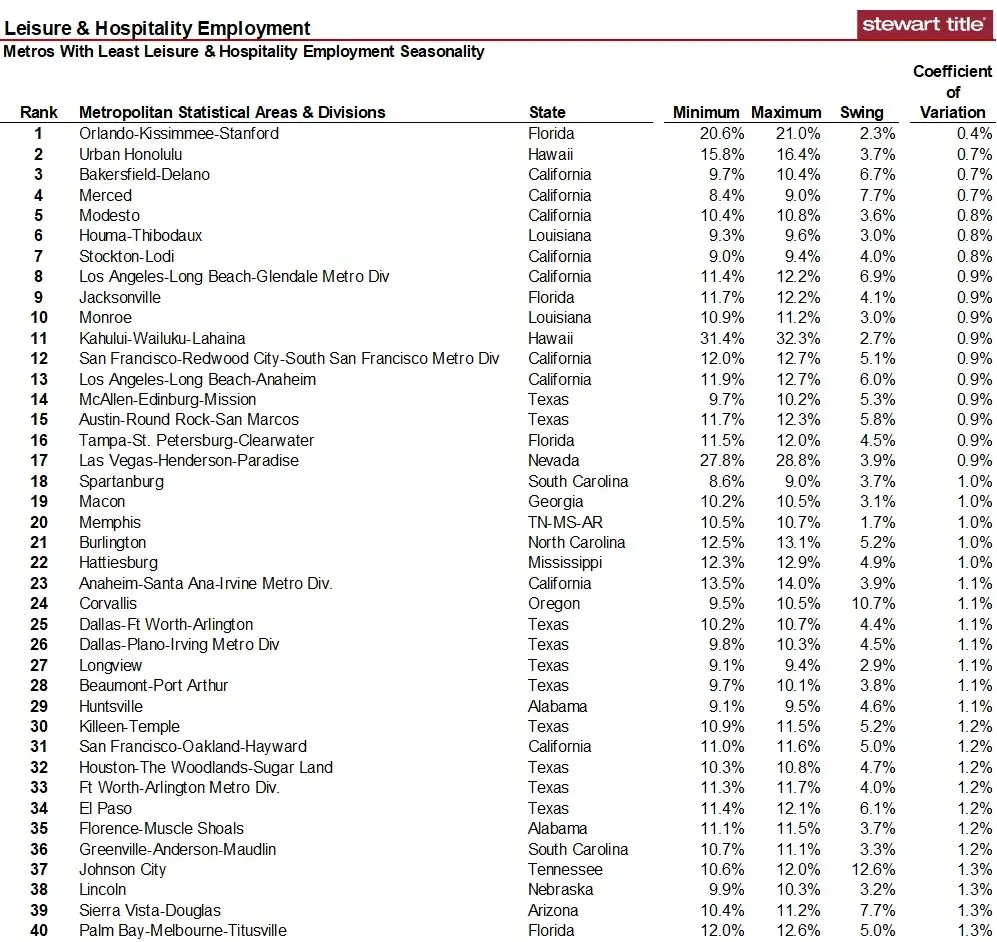
Metros with the most and least L&H seasonality (as indicated by C.V.) are shown in the next two tables. The group with the greatest C.V.s are typically smaller metros with more tourism in seasonal months.
The group with the least seasonality includes some tourist destinations and larger cities. While one-in-five jobs in the Orlando MSA are in L&H (double that of the U.S. average), these vary little from month to month.
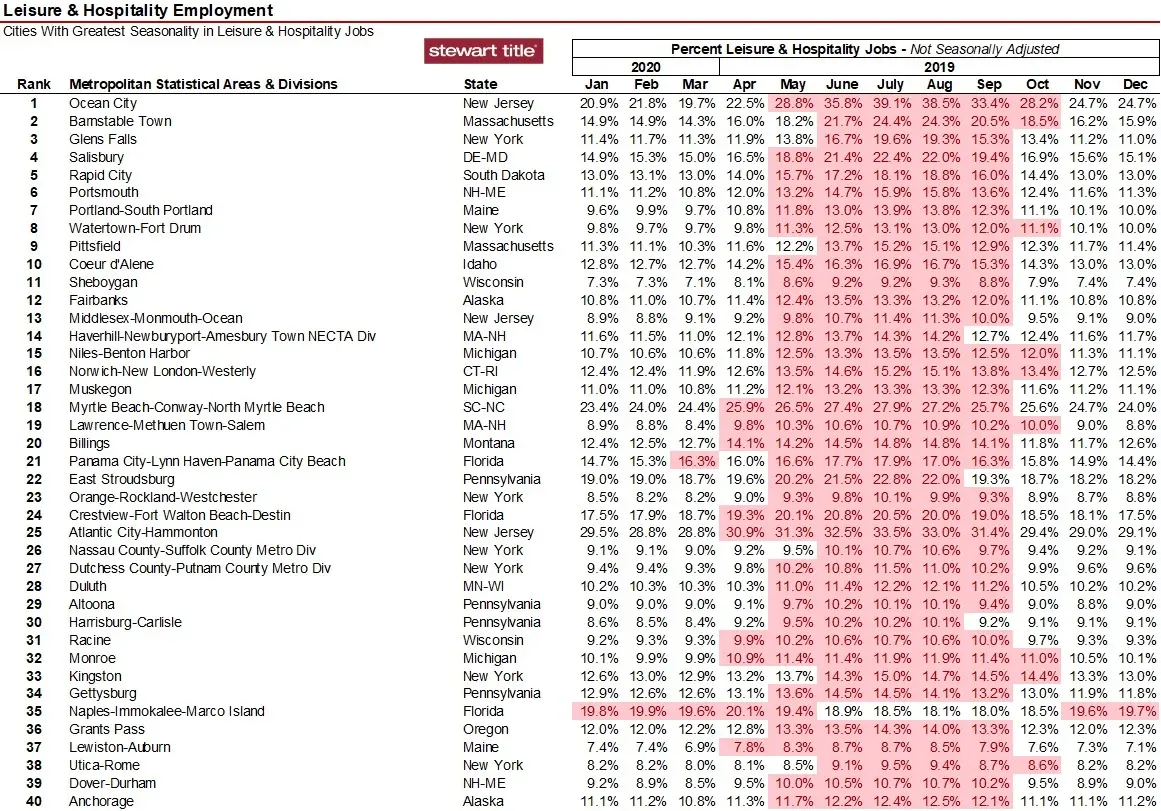
The last table shows the 40 metros with the greatest seasonality (largest C.V.) highlighting the months that exceed that market’s average percentage L&H jobs in the past year. While most markets show peak L&H employment during summer months, the Naples, Florida MSA troughs in those months.
Metrics for all metros with data are shown in the attached PDF, sorted alphabetically by state and MSA-Division.
To access the full NAICS Classification Manual, visit https://gumroad.com/l/2017-NAICS-Classification-Manual. This manual details all jobs included in each of the respective sector codes. L&H jobs commence with the number 7.
For much of the L&H segment, this Coronavirus-driven recession will not be over until we can sit on a crowded airplane, walk into a packed elevator, or attend a popular sporting event without concern. Expect ongoing erosion in L&H jobs in the next few months—particularly in markets primarily accessed by air travel versus automobiles.
Ted
