
May 2020 Jobs Report Miss -- 10 Million More Jobs Than Expected
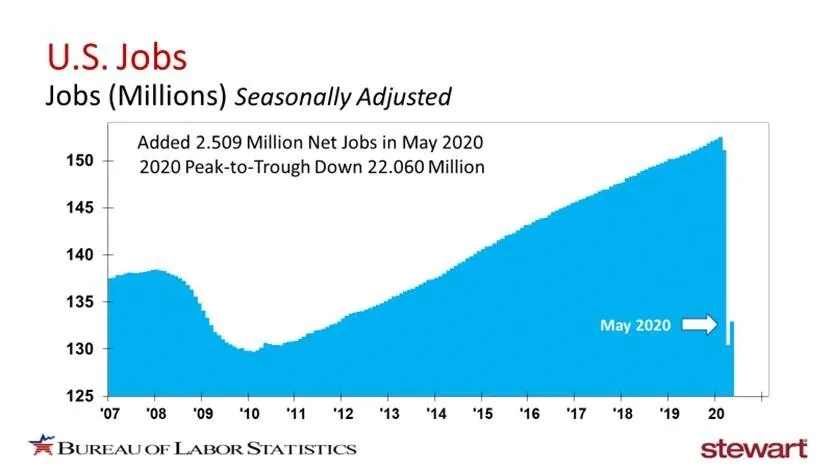
Economists expected an additional 7.5 million decline in the number of nonfarm jobs in May 2020, but the reopening of the economy saw 2.5 million jobs brought back — a swing to the positive of 10 million jobs better than forecast. Economically speaking, this is the best news since the March commencement of the shutdown of the U.S. economy.
The following graph shows total U.S. jobs monthly, on a seasonally adjusted basis, using data reported by the U.S. Bureau of Labor Statistics (BLS). In just two months, essentially all of the jobs added since the trough of the Great Recession were lost between February and April 2020.
In past blogs on jobs reports, the Leisure and Hospitality sector served as a top proxy for the overall health of the economy, stated as follows in the January 2020 blog on the jobs report: U.S. Jobs Report – December 2019: Who Knew “Average” Would Look So Good?
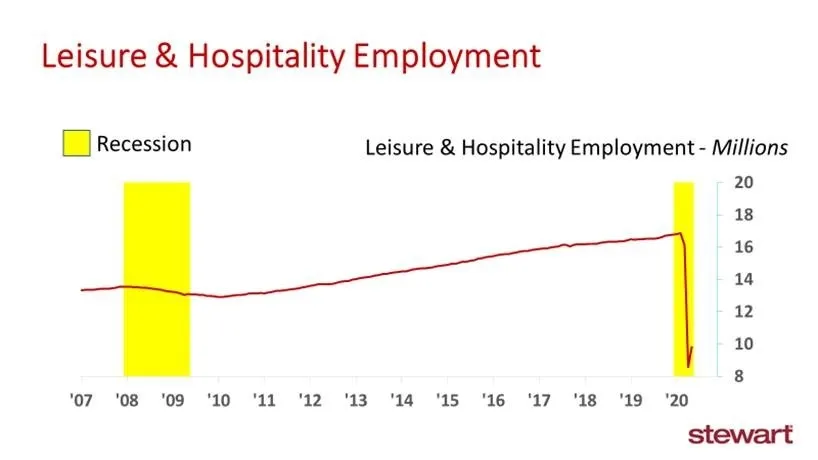
Employment in the Leisure & Hospitality sector continues to be an excellent proxy (in my opinion) of the overall health index of the U.S. economy. People do not spend money on vacations, cruises, entertainment, spas, or expensive dinners out unless they feel good about the future economy.
The following graph shows total Leisure & Hospitality jobs (in millions) monthly since January 2007, along with recessions (including the ongoing downturn). From March to April 2020, one in every two Leisure & Hospitality jobs was lost (46.8 percent, or 7.54 million jobs). In May, however, 1.24 million of those jobs came back as the U.S. economy began reopening.
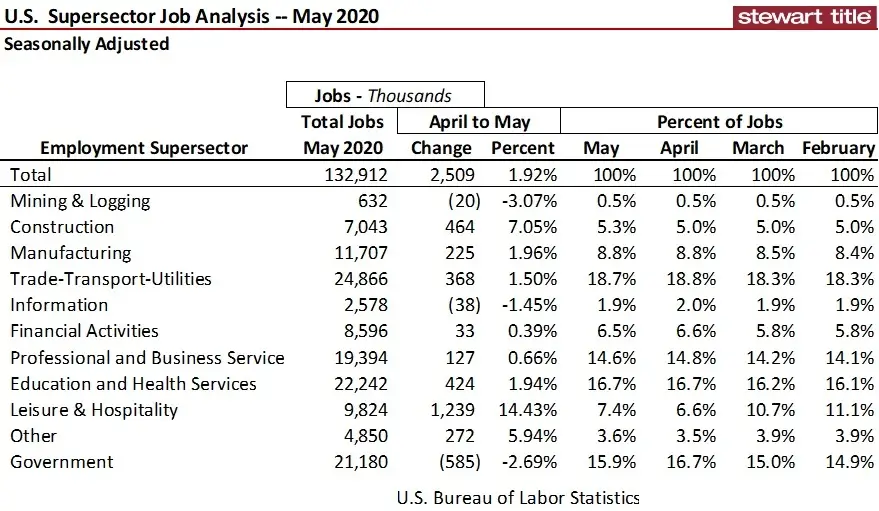
The next table shows employment data by Supersector in terms of seasonally adjusted employment numbers from April to May — in thousands of jobs and percentage change. Also shown by Supersector (seasonally adjusted) are the monthly percentage of all jobs from February 2020 (pre-Coronavirus) through May. February represents the last normal period prior to individual employment sector changes due to the pandemic.
While the initial report showed an improvement in the unemployment rate from 14.7 percent in April to 13.3 percent as of May, that was later corrected due to a classification error by the Bureau of Labor Statistics in their Household Survey. Individuals who should have been classified as Temporarily Unemployed were instead misclassified as Employed But Absent from Work for Other Reasons. This was partially attributable to the unprecedented unemployment levels in recent months and further complicated by changes in survey and data collection methods due to the Coronavirus.
See the previous Stewart blog differentiating this survey from the Payroll Survey or Establishment Survey: April 2020 Jobs Report – Ugliest in Our Lives with More to Come
I also have to eat crow, so to speak, as my blog on the April jobs report was titled:
April 2020 Jobs Report – Ugliest in Our Lives with More to Come
I've never been more pleased to have been incorrect. It remains to be seen whether this will be a V- or U-shaped recovery. At least the May jobs report keeps that debate alive and on the table.
Ted