Metropolitan Statistical Area & Division Job Gains May 2020 -- Only 10% Posted a Loss Compared to April
Just one in ten (10.0 percent) of the 437 Metropolitan Statistical Areas (MSAs) and Metro Divisions posted a decline in the total number of jobs from April to May 2020 according to data just released by the U.S. Bureau of Labor Statistics. Only seven (1.6 percent) posted a continuing decline and 88.3 percent (393) showed improvement from the record-setting job losses posted in April.
The MSAs and Divisions with the best gain from April to May 2020 are shown in the following table. Many of these metros have not been on the top-performing list in decades, but made the list by recovering more of the catastrophic number of jobs lost in April. Elkhart-Goshen, Indiana ranked 433 out of 437 in 12-month growth in January 2020, yet came in 7th best in one-month gain in May 2020. Obviously, for many of the metros May growth was based on improvement from the large April losses and not net growth. Some strong pre-coronavirus performers, however, continued in the top ranks, such as Myrtle Beach-Conway-North Myrtle Beach, the 4th best April to May gains and 20th best in 12-month performance as of January this year.
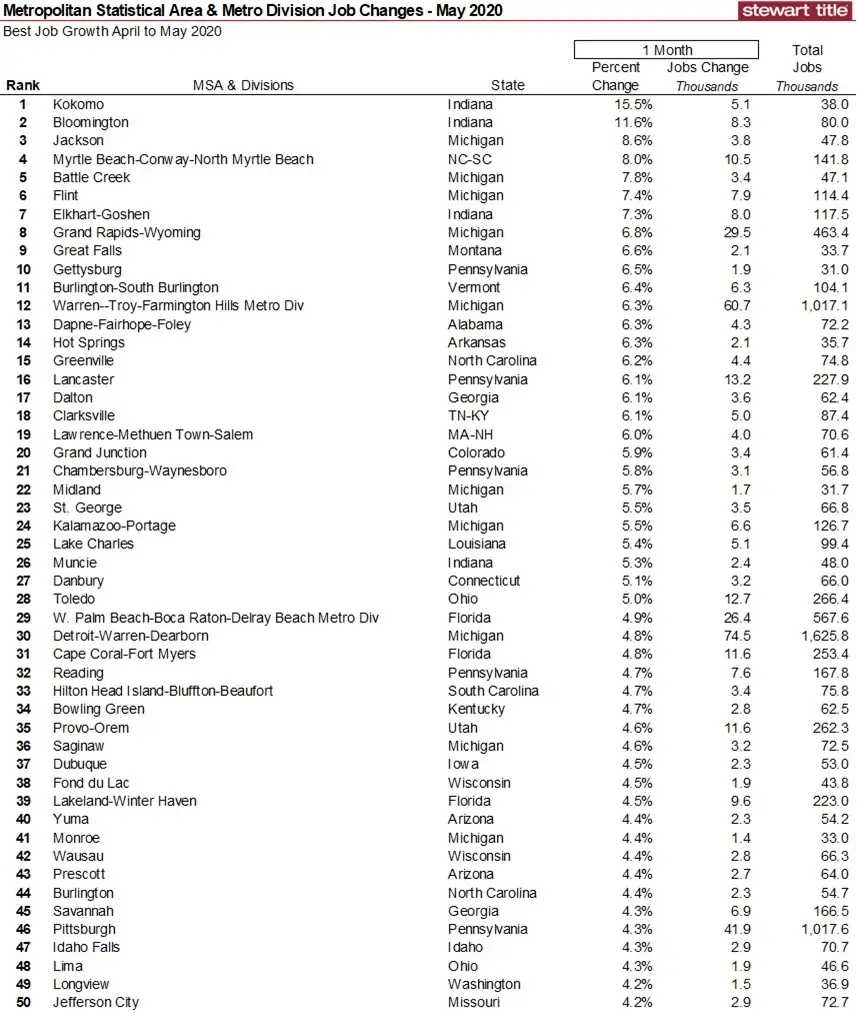
Other Metros saw ongoing job erosion, including the Midland and Odessa MSAs. In the 12 months ending January 2020, Midland ranked 421st and Odessa 422nd (out of 437) in job performance due to falling oil prices prior to the pandemic. They continued the abysmal job performance for the April to May 2020 period coming in at 420th and 383rd, respectively.
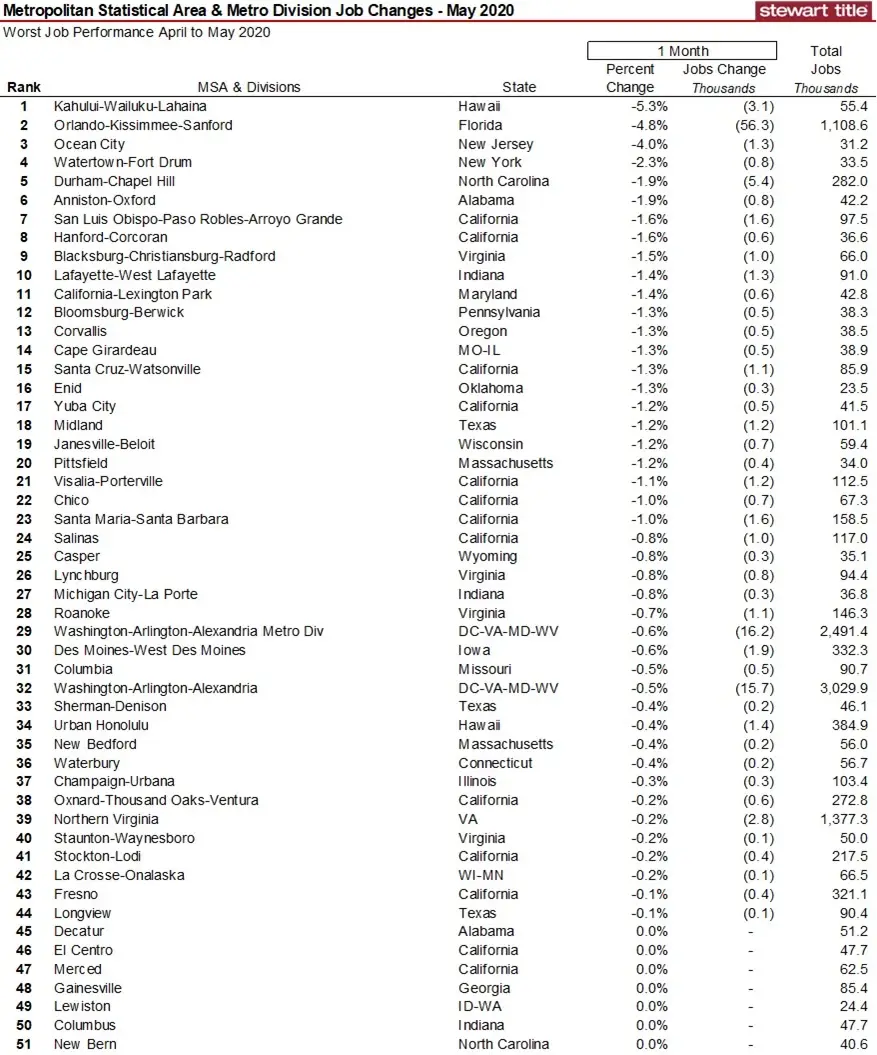
The 51 metros with the worst job performance from April to May 2020 are shown in the following table. Each of these either lost additional jobs from April to May or failed to recover any of the jobs lost in recent months. There is high-percentage of metros with a greater ratio of Leisure & Hospitality jobs in this list – the hardest hit sector by the pandemic. See the prior blog on metros with the most Leisure & Hospitality jobs pre-Coronavirus at http://blog.stewart.com/stewart/2020/05/26/most-at-risk-metros-for-unemployment-due-to-leisure-hospitality-employment-coronavirus-impact/
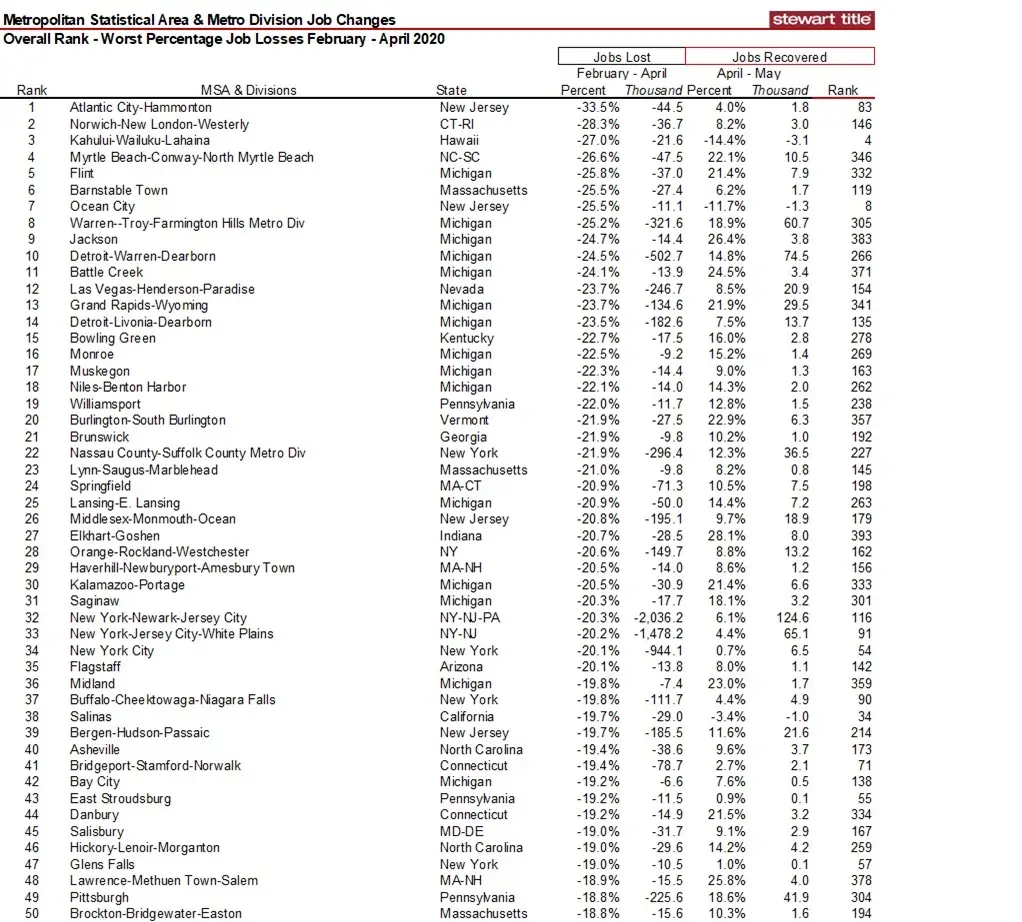
Correspondingly, the larger the percentage of jobs a metro lost from pre-Coronavirus (February) to the April peak, the greater the potential for a better recovery rate in jobs from April to May. The next table shows the 50 metros with the worst percentage jobs lost from February to April. Added also is the rank and percent of jobs recovered from April to May – with a number 1 rank corresponding to the fewest regained jobs. A larger rank corresponds with better performance for each of these metrics. Atlantic City-Hammonton, New Jersey (ranked 1), for example, lost the largest percentage of jobs from February to April (33.5 percent) and recovered just 4.0 percent of those in May -- the 83rd worst recovery rate across all metros.
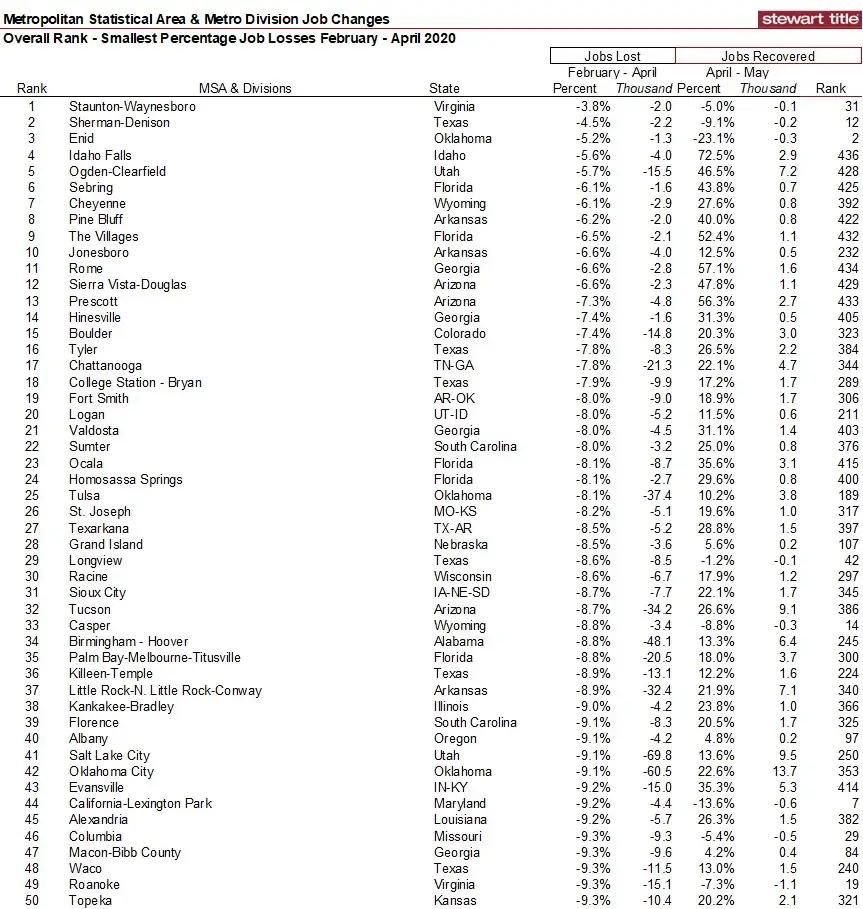
The next table shows the 50 metros with the smallest percentage of job losses from February to April. The three metros with the smallest percent of losses, however, continued to erode jobs from April to May. Note each of the three had a negative number of jobs recovered – though each was relatively minimal.
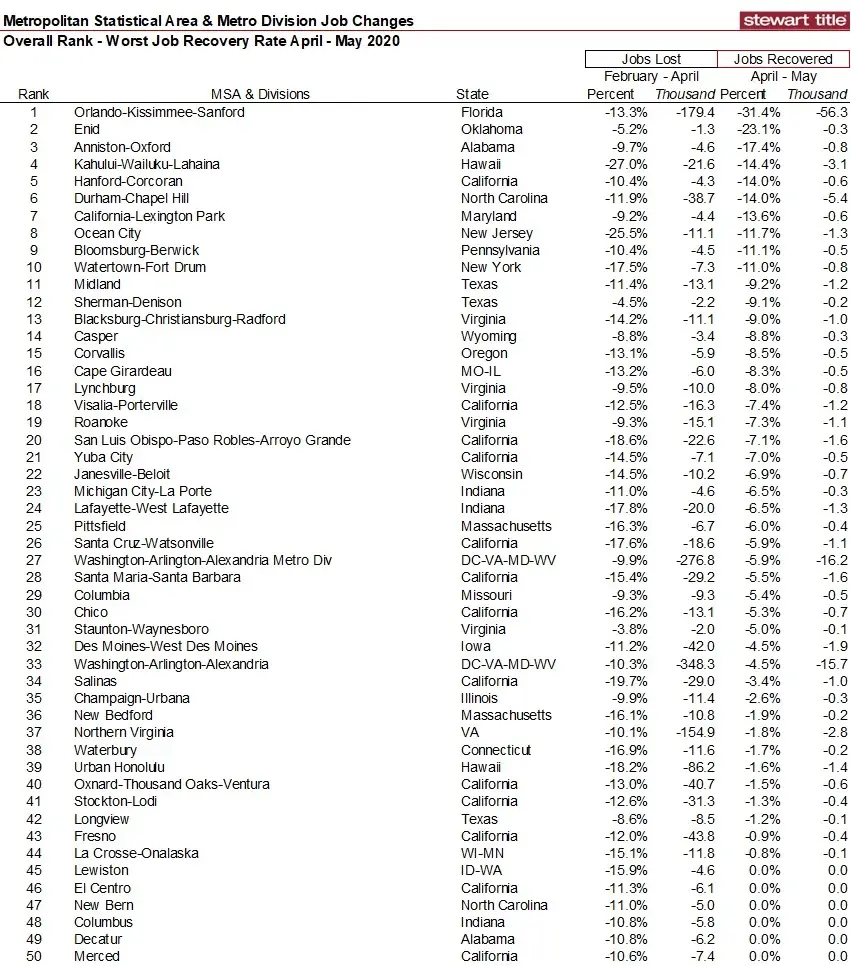
The 50 Metros with the worst percentage of jobs recovered from April to May when compared to jobs lost from February to April are shown in the table. The Orlando MSA lost another 56,300 jobs from April to May 2020, increasing the losses from February to a total 235,700.
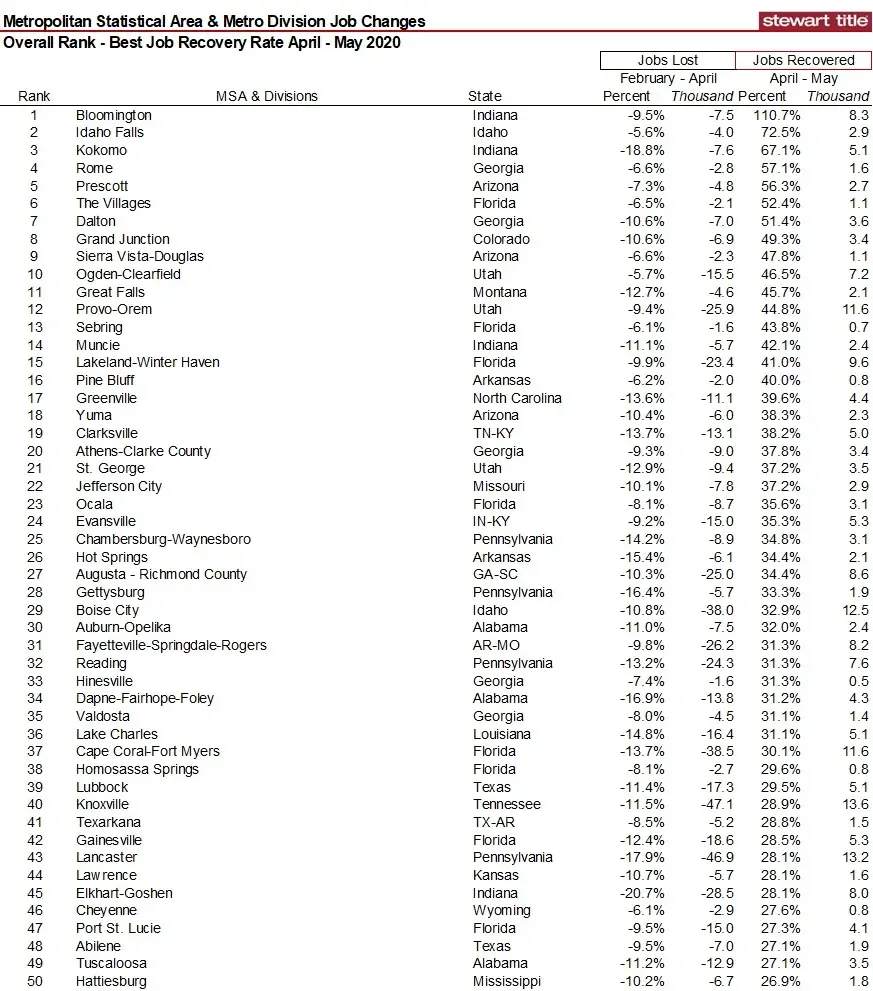
The last table shows the 50 metros in the U.S. having the best recovery rate of jobs lost from February to April. One lone MSA, Bloomington, Indiana, not only has regained all of the jobs lost from February to April but added 800 net new jobs in May. The May data are preliminary and subject to restatement in June, however. If they hold, then the idea that a V-shaped recovery is possible.
Click here for a list of the 1-month, 2-month and 12-month job growth performance for all metros designated as an MSA or Division along with total employment numbers as of the end of May 2020. Also click here for a PDF of the relative ranks of job losses from February to April and the percentage recovered from April to May, sorted by state and metro.
While a V-shaped recovery is being supported for most metros, I do not believe that all jobs will be recaptured nationwide for at least 24 months. The longer it takes for either a vaccine or therapeutic to be developed and brought to the market, the greater the permanent erosion of lost jobs.
Respond back if you have any questions.
Ted
