Existing Home Sales Plunge in May 2020
Existing home sales in May 2020 plunged from a seasonally adjusted analyzed rate (SAAR) of 5.76 million in February to 3.91 million as of May (down 32.1 percent and a year-over-year drop of 26.6 percent according to the National Association of Realtors® (NAR). In comparison, during the housing bubble implosion, the largest decline was 30.1 percent plunging from 6.31 million on a SAAR in December 2006 to 4.41 million in December 2007. Median price was up 2.3 percent to $284,600 in May 2020 year-over-year, notching the 99th consecutive month of year-over-year gains.
The idiom that, “A picture is worth 1,000 words,” does not apply to the following graph of existing home sales. It only takes one word to describe: UGLY. Data include monthly median home prices.

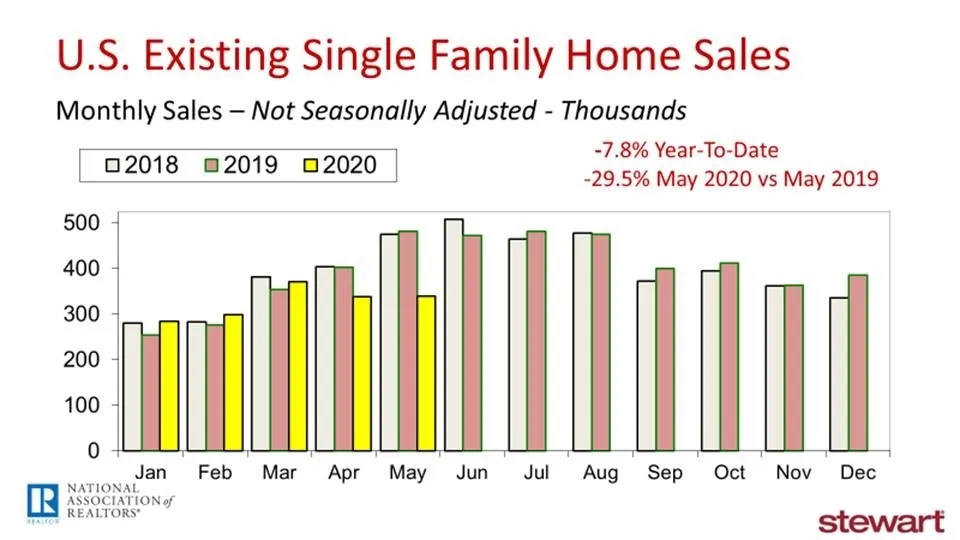
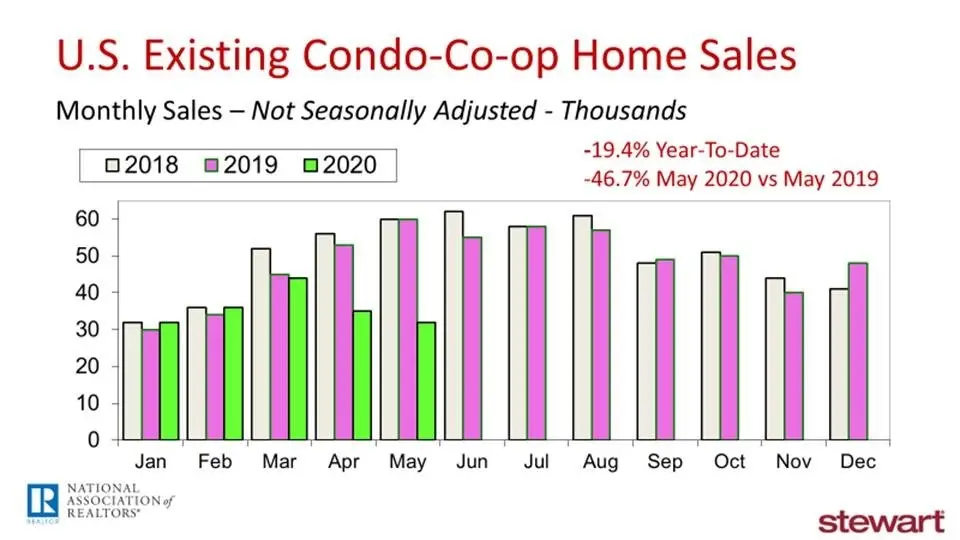
Within the home sales is another story. NAR’s home sales include single family, townhouses, condominiums and co-ops. While single family home sales were down 29.5 percent in May 2020 versus the prior year on a raw, not-seasonally adjusted rate, condominium and co-op sales were off an astounding 46.7 percent for the same period. Obviously the pandemic is making a difference in consumer preferences for greater separation from other – at least for now. Though the median single-family home value of $287,800 was up 2.4 percent year-over-year in May, it slipped 1.6 percent for condo co-op properties to $252,300. The next two graphs show the monthly raw non-adjusted sales for 2018, 2019 and 2020 year-to-date for single family and condo + co-op units.


Other details in NAR’s press release included:
- Total inventory of homes available for sale at 1.55 million units was up 6.2 percent from April but down 18.8 percent compared to May 2019
- The current estimated supply equates to a 4.8 month inventory of homes for sale, up from 4.0 months in April and the 4.3 months seen a year ago, with 6 months inventory considered to be normal
- 1 st -time buyers acquired one-in-three of May closings (34 percent), up slightly from 32 percent last May but off from 36 percent in April
- Investors made up 14 percent of all buyers in May, up from 10 percent in April and similar to last May at 13 percent
- One-in-six May home closings (17 percent) were all-cash transactions, bounded by 15 percent in April and 19 percent in May 2019
- The typical property was on the market for just 26 days in May prior to going under contract, unchanged from a year ago
- 58 percent of all homes sold in May were on the market less than one month
- Though still a small number, 3 percent of all May home sales were distressed properties (either short or foreclosure sales), up from just 2 percent in May 2019
To read the entire press release from NAR click https://www.nar.realtor/newsroom/existing-home-sales-fall-9-7-in-may-while-nar-expects-strong-rebound-in-coming-months
While NAR and others remain optimistic about rebounding home sales in coming months, the massive unemployment jump from a 50-year low 3.5 percent in February this year to 13.3 percent as of May (after peaking at 14.7 percent in April) warrants consideration. With an added one-in-10 individuals today unemployed, the potential homebuyer pool had to have shrunk. The increase of the average hourly wage from $28.52 in February to $29.75 in May (after peaking at $30.04 per hour in April) reveals that lower-income workers took the brunt of the Coronavirus-driven layoffs. Rising wages were a statistical anomaly of a shrinking lower income segment rather than actual rising wages.
Analysis of several home listing sites report increased views in suburban and smaller markets, though purchase trends have yet to show if that is a realized actual change in homebuyers. Time will tell.
Ted
