Job Gains and Losses In the Pandemic February Through July 2020 -- by MSA
This monthly analysis of jobs differs from previous versions that included both Metropolitan Statistical Areas (MSAs) and Metropolitan Divisions (which are subsets of the MSAs). Only the MSA level data are included in this blog. Data are based on seasonally adjusted monthly employment from the Bureau of Labor Statistics (BLS).
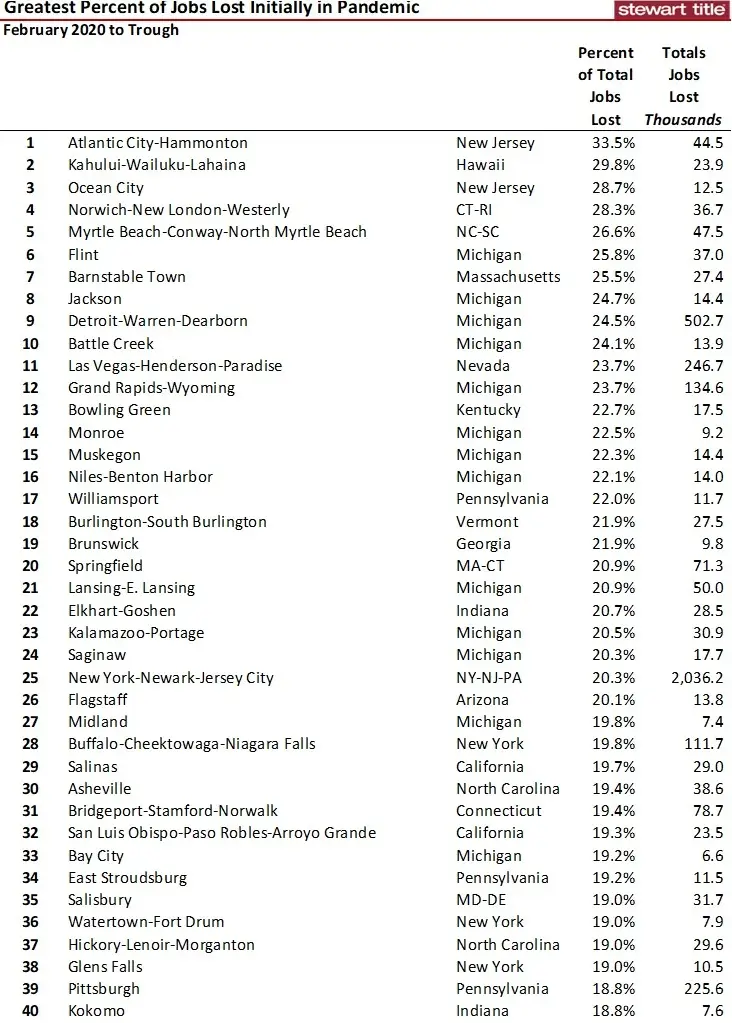
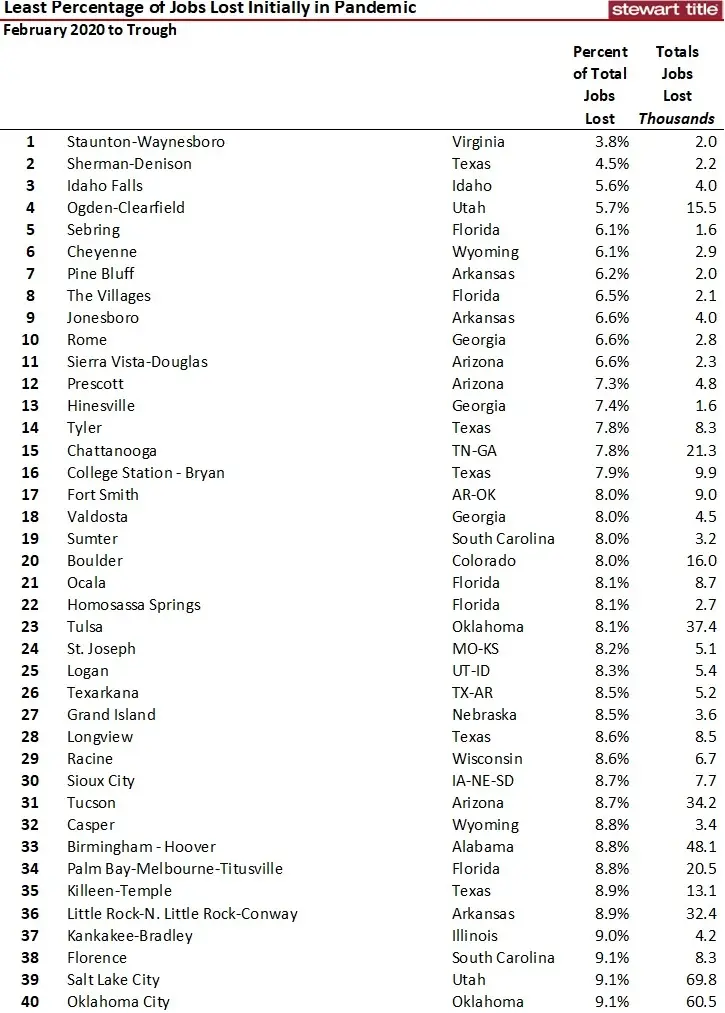
Jobs peaked in the U.S. in February this year prior to the impact of the pandemic. Total jobs lost was calculated by subtracting the trough in jobs from March through July from the pre-Coronavirus peak in February. The 40 MSAs each with the greatest- and least-percentage of jobs lost from the peak to the trough are shown in the next two tables which includes the percentage of jobs and number lost (in thousands). The range is substantial with one-in-three jobs (33.5 percent) dropping away in the Atlantic City-Hammonton, NJ MSA to just 3.8 percent in the Staunton-Waynesboro, VA MSA.
The next two tables show the 40 MSAs with the best and worst recovery as of July 2020 based on the percentage of jobs lost. This was calculated by subtracting the total number of jobs gained from the trough to the peak from the number lost from February to the trough. Five MSAs not only added back all jobs lost since February, but have also created additional jobs than existed in February of this year, while three others have yet to recoup jobs at all.
Idaho Falls, Idaho, _which now had 2,600 more jobs as of the end of July than February_
Staunton-Waynesboro, Virginia _up 500 jobs in July vs February_
Sebring, Florida, _up 300 jobs in July compared to February_
Sierra Vista-Douglas, Arizona _up 100 jobs_
Missoula, Montana, _up 100 jobs_
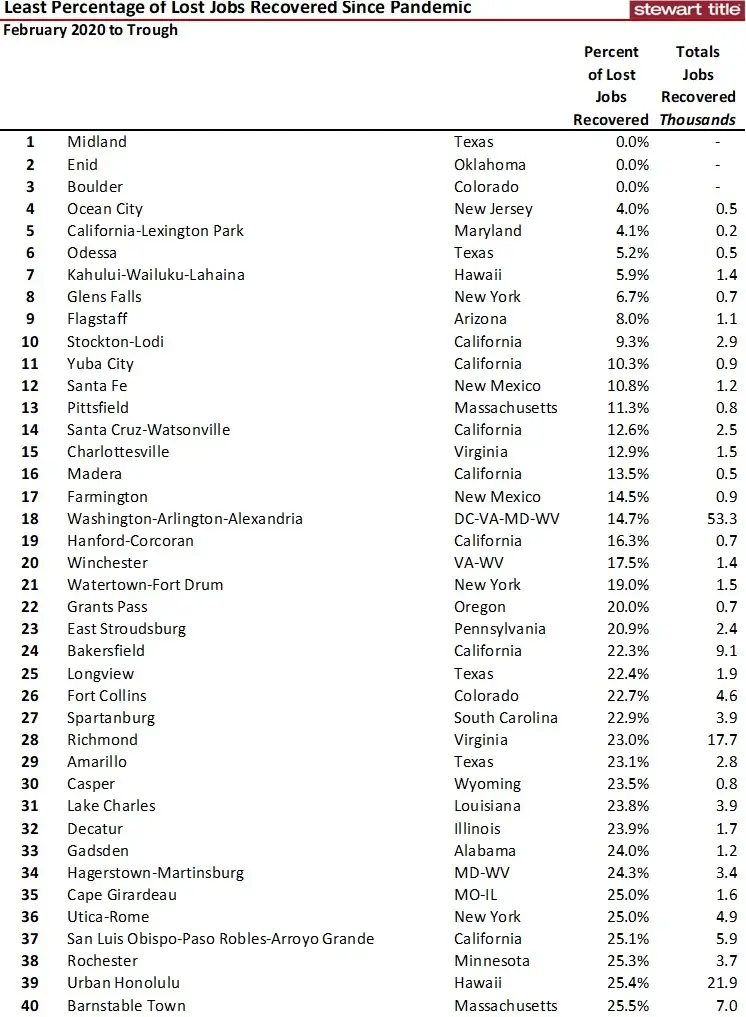
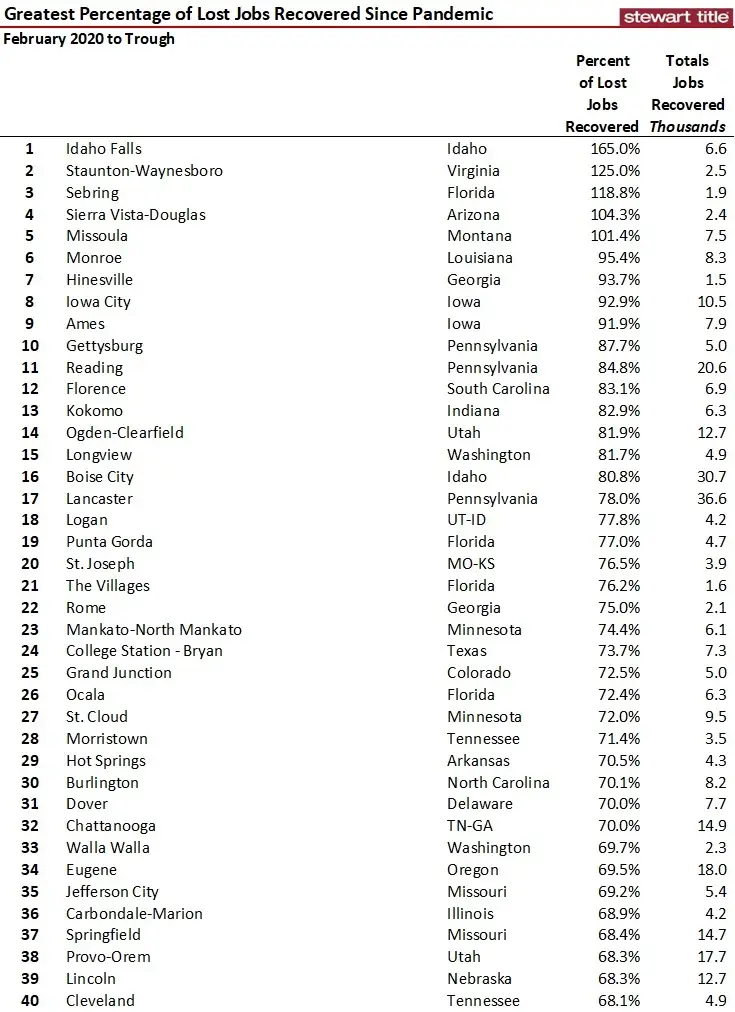
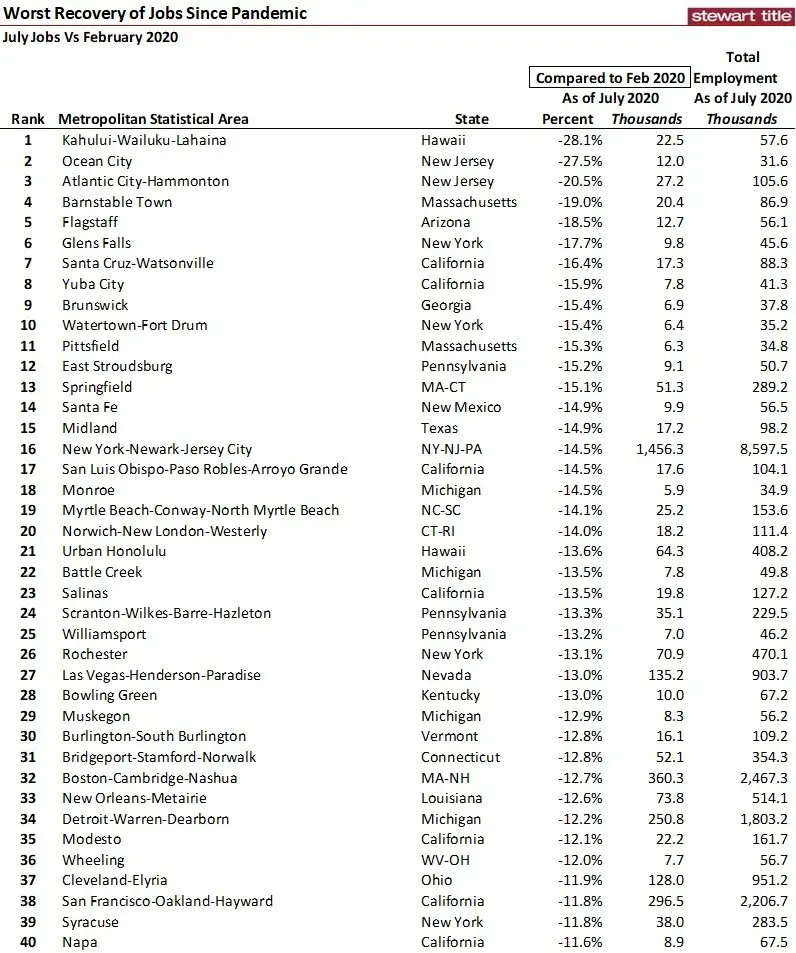
The last two tables show the relative number of jobs as this July to the February 2020 level for the 40 most- and least-recovered MSAs. Idaho Falls, the best recovered MSA in the U.S., had 2,600 more jobs at the end of July than in February – a gain of 3.6 percent since February. Some MSAs continue to erode jobs. Many of the MSAs with poor recovery have a larger percentage of Leisure & Hospitality sector employment or rely on oil and gas production, both heavily impacted by the pandemic.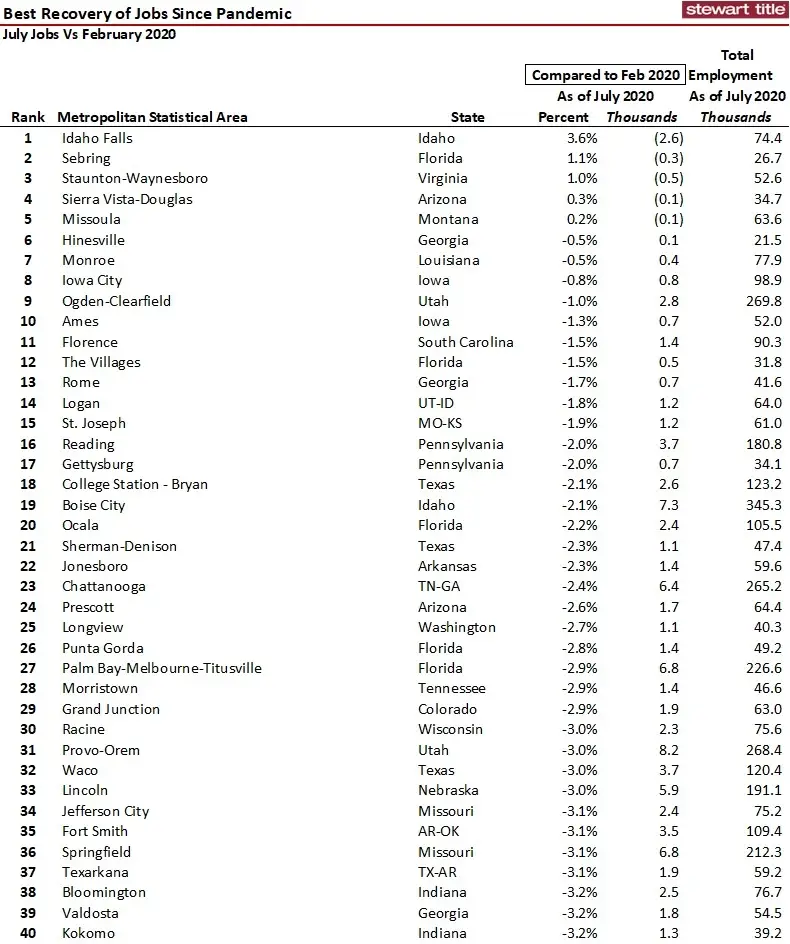
Click here for a PDF showing these results for all 384 MSAs sorted by state and MSA, excluding three for which the Bureau of Labor Service does not provide seasonally adjusted data.
As the second round of pandemic-related layoffs take place, some of the jobs recovered may have been just temporary and there is no new economic stimulus in place at this time. As always, jobs are everything to the economy and the ultimate demand for real estate.
Ted
