Booming Sales and Minimal Inventory -- Existing Home Sales September 2020
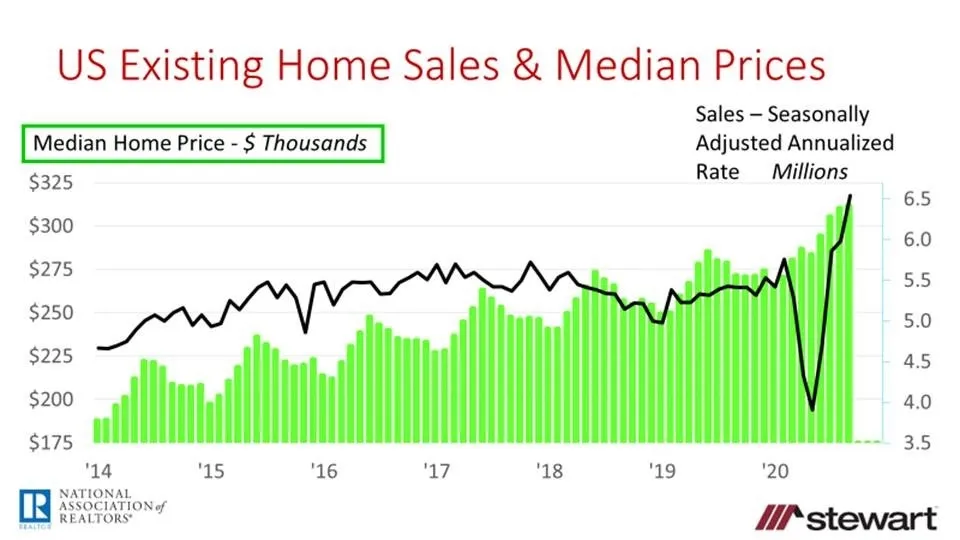
Existing home sales exploded up a massive 20.9 percent to 6.54 million in September 2020 based on seasonally adjusted annualized sales (SAAR) vs one year ago as reported by the National Association of Realtors® (NAR). This was the greatest rate of sales seen since May 2006 on a SAAR. Raw unadjusted sales rocketed up 24.7 percent from 450,000 in September 2019 to 560,000 in September 2020. Sales totaled 4.037 million homes in the first nine months on a raw basis, down just 0.2 percent from the first nine months of 2019 after tumbling in April, May and June due to Coronavirus.
While sales have risen to a 14 year-high on a SAAR, the inventory of homes available for sale tumbled to 1.47 million at the end of September 2020 compared to 1.82 million a year ago, a drop of 19.2 percent. At the September sales pace there was just 2.7 months of inventory of homes available for sale – an all-time record low.
Median home sales price hit an all-time record $311,800 in September, up 14.8 percent from a year ago while the average price rose 11.6 percent to $343,300.
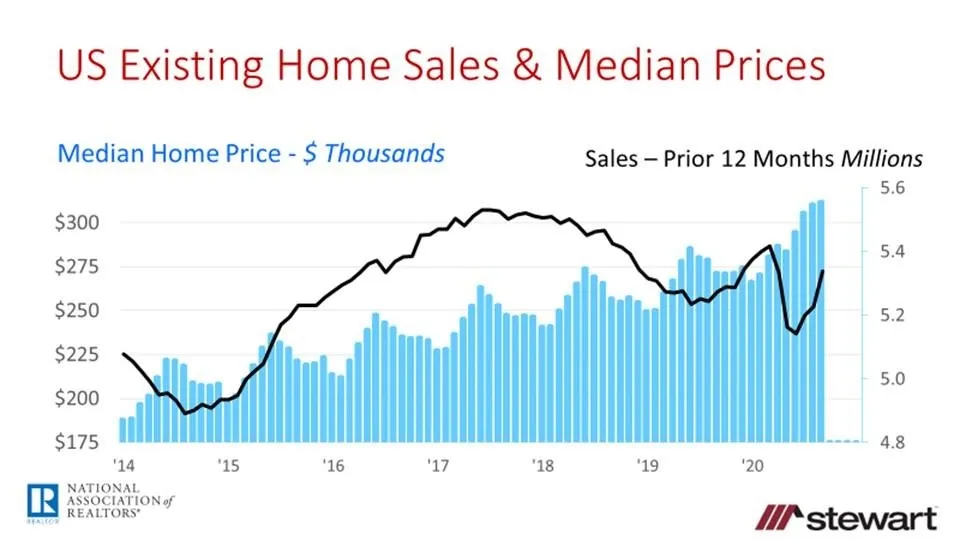
Sales and median prices are shown in the following two graphs. Each show median prices, with the first using the SAAR of home sales and the second the total number of sales in the prior 12-months (raw monthly sales summed). On a trailing 12-month basis, existing home sales were up 1.2 percent in September vs a year ago.
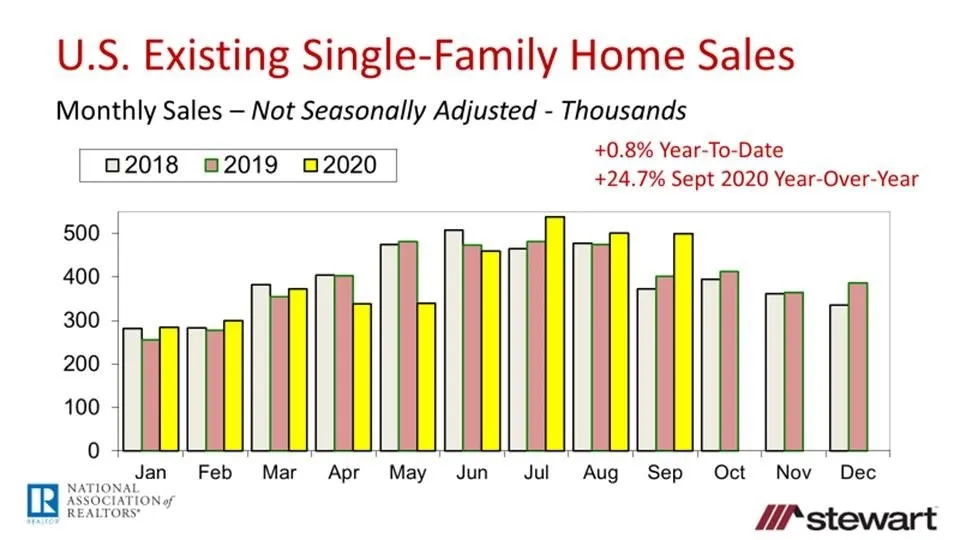
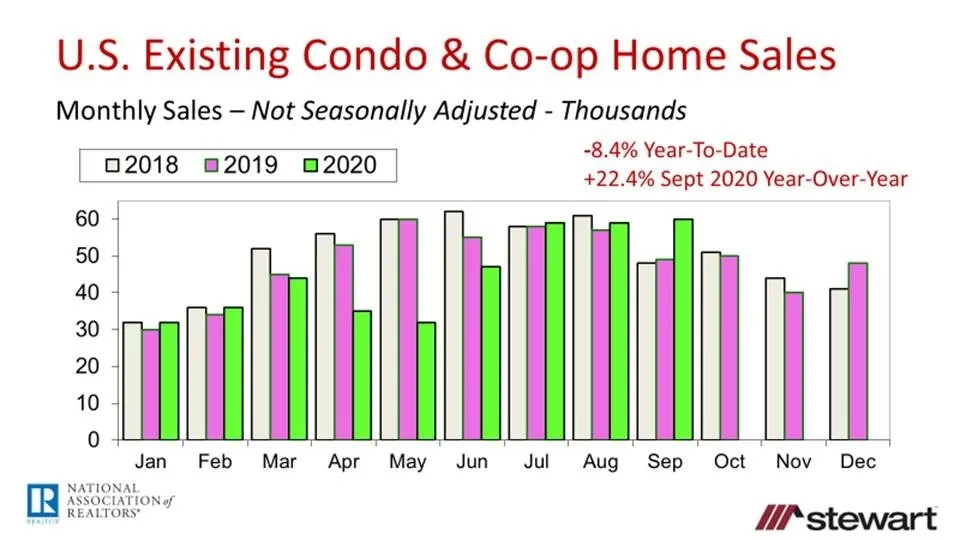
The next series of graphs show total sales, single-family sales, and combined condo & co-op sales monthly (raw unadjusted) commencing in January 2018. Total monthly sales were essentially flat year-to-date (-0.2 percent), but up a massive 24.4 percent compared to one year ago. Single-family sales rose a miniscule 0.8 percent year-to-date but were up 24.7 percent for the month, while Condo & Co-Op sales were down 8.4 percent year-to-date but up 22.4 percent for the month.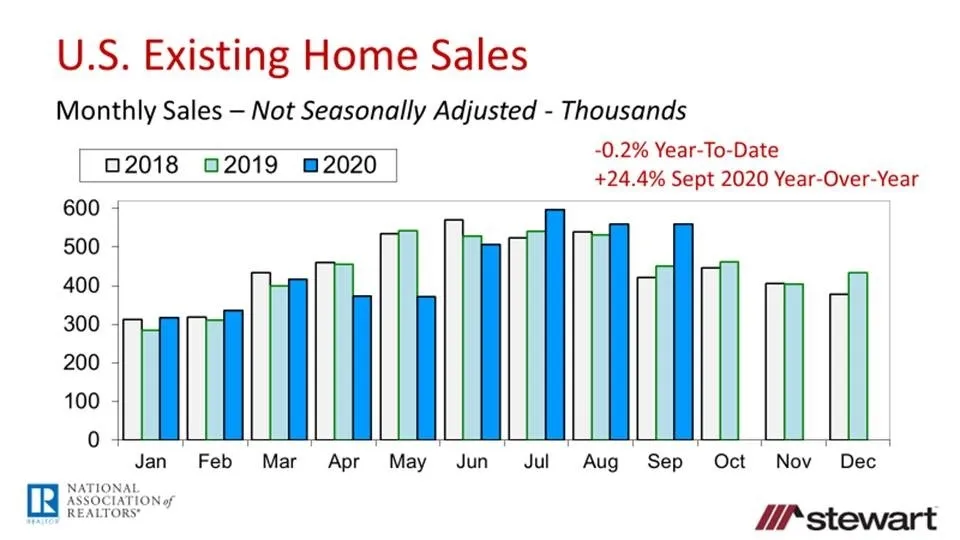
Sales by price range reveal that the hot-housing market knows no bounds by price range. NAR conducts a monthly sample (not seasonally adjusted) regarding the percentage change in single-family sales and inventory from one year ago, and distribution of sales by price range. The following table shows these metrics on a national basis as of September 2020. Inventory declined or essentially remained flat in every price range on a year-over-year basis. Sales rose in all price ranges from $100,000 and up. Shrinking inventory no doubt slowed sales in the $100,000 and less segment. The greatest year-over-year increase in sales was in the $1 million plus range, more than doubling compared to a year ago, with the $750,000 to $1 million segment up 85.5 percent and home sales from $500,000 to $750,000 up 36.2 percent.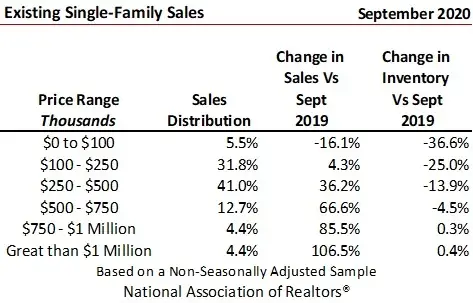
Other details in NAR’s press release included:
- Median home prices have now risen on a year-over-year basis 103 consecutive months
- Properties typically remained on market just 21 days in September, an all-time record low and down from 32 days one-year ago
- 71 percent of all homes sold in September 2020 were on the market less than one month
- 1 st -time homebuyers bought three-in-10 (31 percent) of all sales in September
- Investors acquired one-in-eight sales (12 percent), down slightly from 14 percent a year ago
- Buyers paid all-cash for almost one-in-every five sales (18 percent) in September similar to 17 percent a year ago
To read the entire NAR press release click https://www.nar.realtor/newsroom/existing-home-sales-soar-9-4-to-6-5-million-in-september There are two driving factors behind the robust home sales:
- All-time record low interest rates significantly impacting affordability – see http://blog.stewart.com/stewart/2020/10/06/housing-affordability-a-lot-better-than-you-think-and-a-phenomenal-2021-outlook/
- Given the pandemic, we now spend more time than ever before at home, making the home more intrinsically valuable to people than anytime in our lifetimes today
Interest rates will eventually rise which will slow both sales and home price gains. For now, housing is hot -- at least for those employed. Jobs are everything to the economy and housing market. Just follow jobs to see where the housing market is heading. Jobs are everything. Period.
Ted
