Best (and Worst) State Business Tax Environments 2021 - The Tax Foundation
Just as Elections Have Consequences, Taxes Have Ramifications. This annual blog on the Best (and Worst) State Tax Business Environments is a summary of the Tax Foundation’s annual report on comparing all 50 states across multiple taxes.
Every state differs in where revenues are sourced, tax amounts and what services they provide. The TINSTAANREM axiom is applicable — There Is No Such Thing As A National Real Estate Market or economy. The same is true with respect to state taxes and services.
As similarly stated last year:
Taxes, or lack thereof, can be an attraction or a deterrent to businesses relocating to or expanding across the country. As an economist, for example, I would have an issue residing where there was a state income tax. Taxes are not the only reason why firms stay, move or expand, however. There is a vast array of factors as to why businesses locate where they do: access to transportation, resources, skilled employees, markets, and family. When I was in graduate school, a valuable key course that specifically addressed this was named The Theory of the Firm in Economic Space. It was taught by Dr. Melvin Greenhut, a globally renowned economist in the study of why firms locate where they do. In modern terms and in addition to the previously mentioned tax factors, other items of importance in Dr. Greenhut’s findings included:
- Jet Airline Service
- Interstate Highways
- Rail Service and Ports (for those businesses needing transportation access)
And perhaps most importantly: It Had to be a Location Where the CEO Wanted to Live.
How do the states compare when it comes to taxes? To answer this, each year the Tax Foundation, a non-profit based in Washington, D.C., ranks the tax friendliness of each state. This report is known as the Tax Foundation’s State Business Tax Climate Index. Each state is ranked based on five taxes with the weighting of each noted below. The weightings change slightly from year-to-year. The weighting differences were established as follows as stated in the Tax Foundation report:
“The five components are not weighted equally, as they are in some indices. Rather, each component is weighted based on the variability of the 50 states’ scores from the mean. The standard deviation of each component is calculated and a weight for each component is created from that measure. The result is a heavier weighting of those components with greater variability.”
30.1% — Individual Income Tax
24.4% — Sales Tax
20.8% — Corporate Tax
14.8% — Property Tax*
9.4% — Unemployment Insurance Tax
* Included are taxes on tangible and intangible personal property and other classes of wealth including real estate, inheritance and gift taxes
The 10-best state tax environments based on these five taxes and respective ratings are detailed in the table, including state-specific ranks by type of tax. Multiple states have no state corporate or personal income taxes with each having a tied ranking of 1.

The worst-ranking states are detailed in the next table.

The overall ranking for each state is shown in the following graphic which is sourced from the Tax Foundation.

The following tables show the best- and worst-10 rankings among each of the individual tax categories.
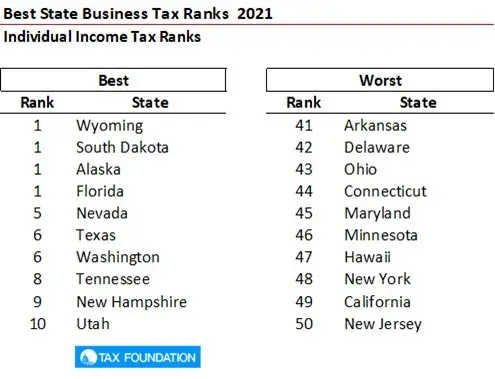
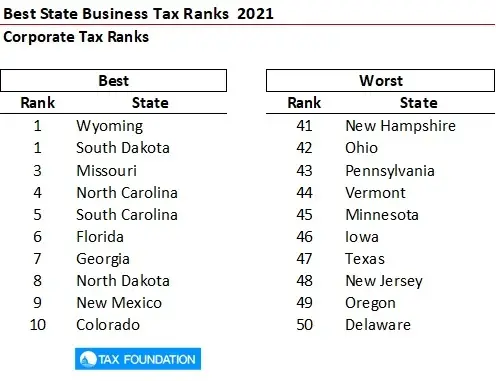
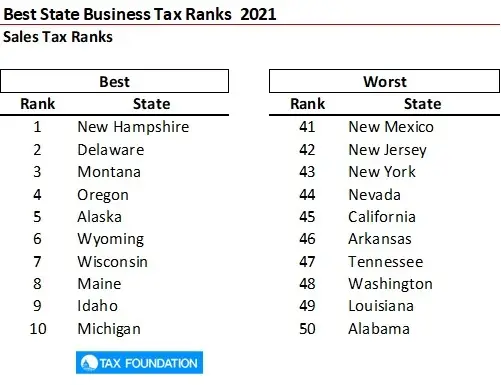
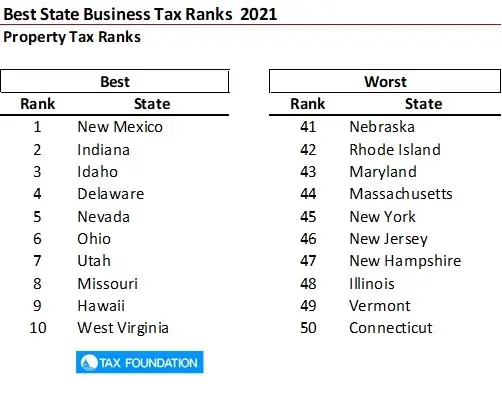
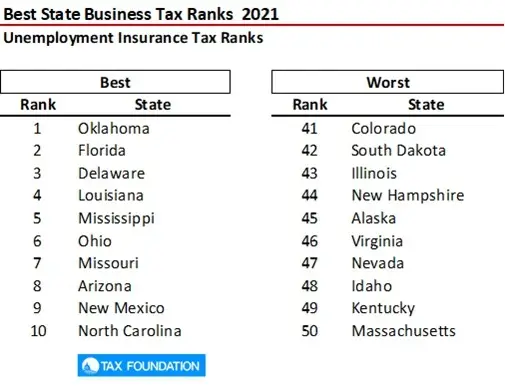
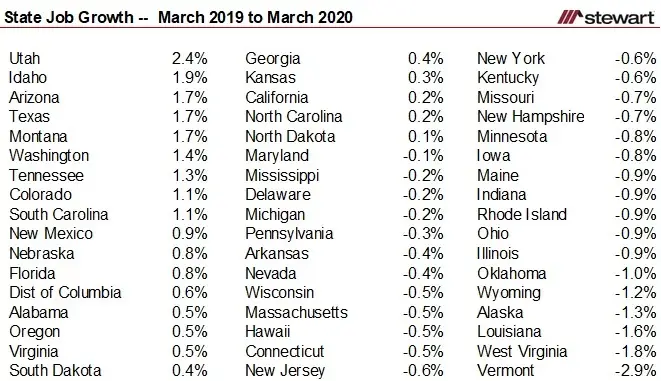
Just because a state has a great tax environment, however, does not always equate to a strong and growing economy. The next two tables show job growth rates for all 50 states and the District of Columbia. The first table details growth rates for the 12-months ending March 2020 (prior to the pandemic) while the second lists job loss rates for the 12-months ending August 2020 – which includes the pandemic. While Alaska has the 3rd best overall business tax environment, it ranks 47th in job growth for the 12 months ending March 2020 (pre-pandemic) and 45th in the 12-months ending August 2020. Some of the best tax environments do have strong job growth rates. Utah ranks 8th best in Tax environment and 1st and 2nd best for job growth for the 12-months ending March and August, respectively.

To review the summary and download the complete study from the Tax Foundation click https://taxfoundation.org/2021-state-business-tax-climate-index/
To learn more about the Tax Foundation and their research click https://taxfoundation.org/
Just as Elections Have Consequences, Taxes Have Ramifications.
Ted
