Q3 2020 Commercial Real Estate Cycles - Dr Glenn Mueller
This roller-coaster pandemic-altered economy is generating a smoke screen on the underlying fundamentals of the commercial real estate market. While Jobs are everything to an economy, the U.S. is still short from where it was in February of this year. While the housing market has boomed (since we have so much time at home), the same is not true for all types of commercial real estate. Detailed insight is needed to help ascertain where real estate markets are at and heading. Dr Glenn Mueller’s quarterly Commercial Real Estate Cycles report gives just that insight.
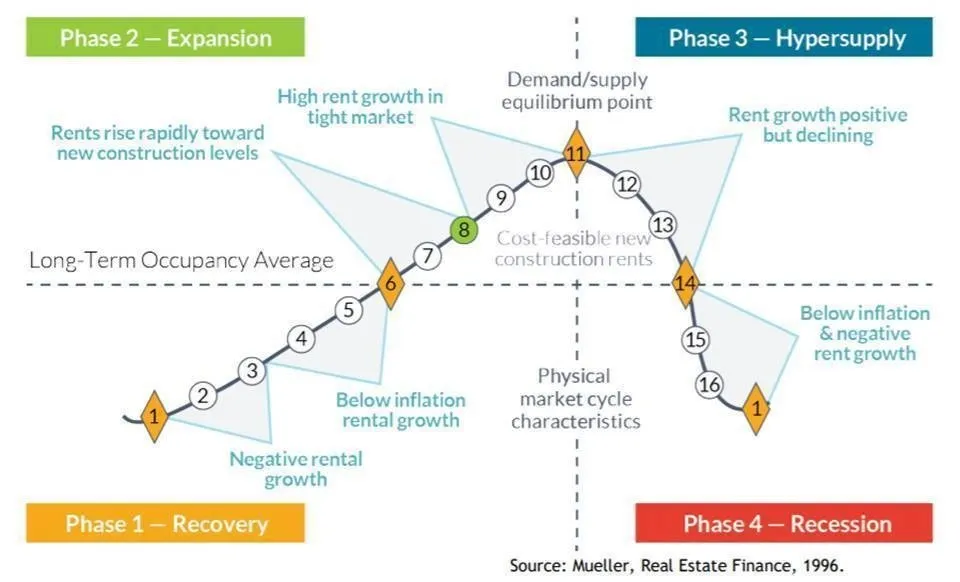
Dr. Mueller defines four distinct phases in the commercial real estate cycle providing decision points for investment and exit strategies. Long-term occupancy average is the key determinant of rental growth rates and ultimately property values. Ideally, Phase 2 - Expansion is the sweet-spot in for real estate investor performance as shown in the following two graphs.

Across the cycle, Dr. Mueller has described rental behavior within each of the phases, using market levels ranging from 1 to 16. Equilibrium occurs at Market Level 11 in which demand growth equals supply growth – literally the sweet spot. The equilibrium Market Level 11 is also the peak occupancy level.
Phase 1 - Recovery _Declining Vacancy, No New Construction_
1-3 Negative Rental Growth 3-6 Below Inflation Rental Growth
Phase 2 - Expansion _Declining Vacancy, New Construction_
6-8 Rents Rise Rapidly Toward New Construction Levels 8-11 High Rent Growth in Tight Market
Phase 3 - Hypersupply _Increasing Vacancy, New Construction_
11-14 Rent Growth Positive But Declining
Phase 4 - Recession _Increasing Vacancy, More Completions_
14-16, then back to 1 Below Inflation, Negative Rent Growth
These are illustrated in the following graphic from Dr Mueller’s report. The long-term occupancy average is a key factor in ascertaining rental growth rates – which in turn impact value.

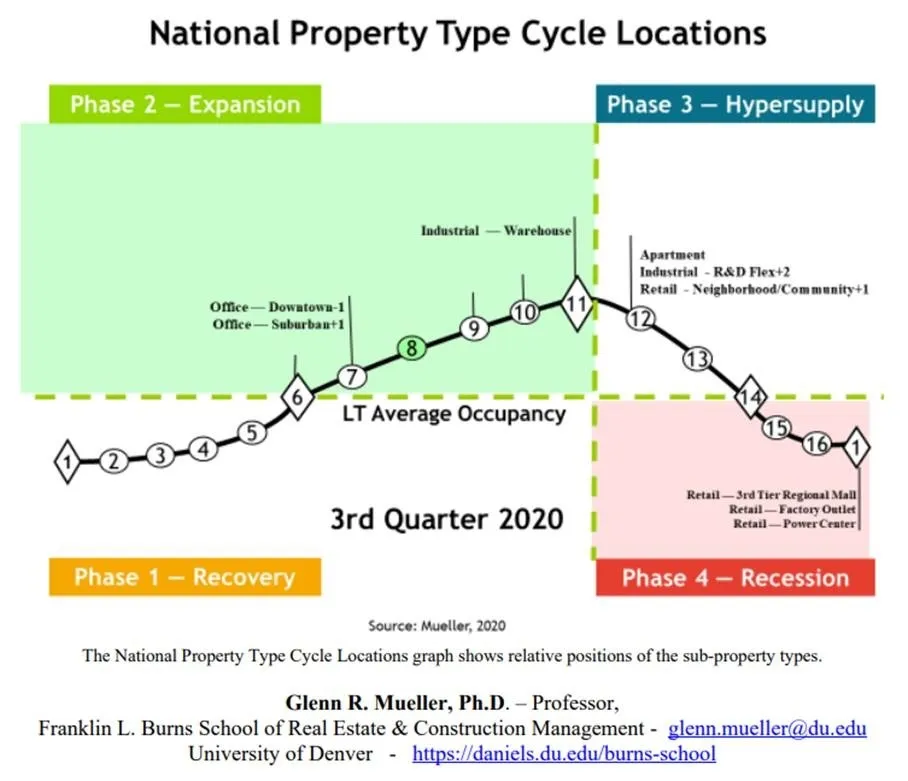
Dr. Mueller’s Q3 2020 report shows the current cycle stage from a national perspective across property types. Apartments and retail, with ongoing new deliveries in the past six years and a pipeline of construction ongoing, are in Phase 3 - Hypersupply with rents still increasing but at a declining rate. Industrial warehouse property is now the big winner in real estate – no doubt being driven by ecommerce needs and sits at Equilibrium Market Level 11. Three Retail Property Types now reside at or near of the bottom scale of Phase 4 - Recession: 2nd Tier Regional Malls, Factory Outlet Centers and Power Centers.

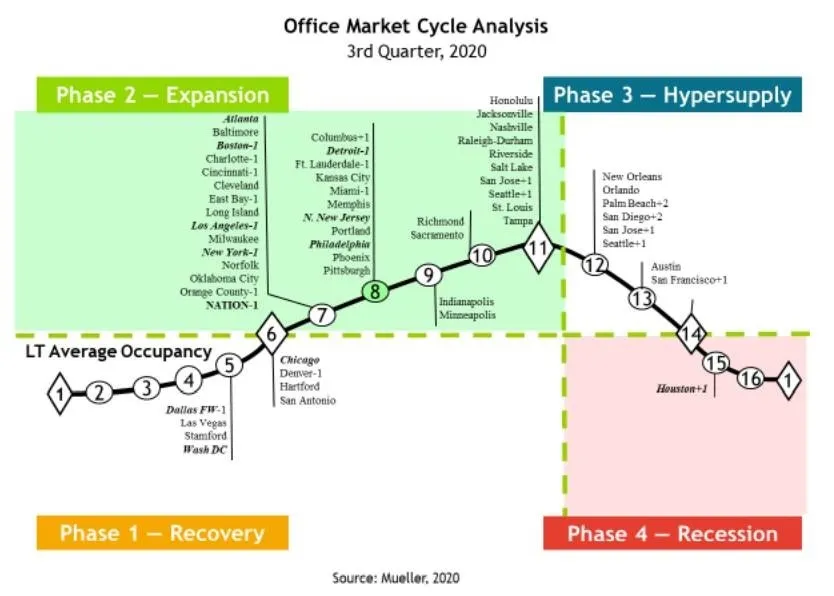
In a separate study, Cushman & Wakefield reported that the U.S. saw an unprecedented 64 million square feet of negative absorption in office space in Q2 and Q3 of this year, along with another 128.6 million square feet of new construction ongoing (see my twitter account at https://twitter.com/DrTCJ). The following table from Mueller’s report shows the status of office markets across 54 major U.S. metros for Q3 2020. At the bottom is Houston, which is included in Phase 4 - Recession. Another brokerage study reported Houston has an estimated 26 percent vacancy rate in office space. Just 10 of the metros are considered to be at equilibrium Market Level 11 with eight each metros in Phase 3 - Hypersupply and Phase 1 - Recovery.

Mueller’s quarterly report, which is based on more than 300 individual econometric models, also includes these metrics for apartments, industrial and retail properties across the 54 metros.
Pay attention to each of the property types in the report focusing on cities that have excess supply, and also those with supply trailing demand.
To download current and historical quarterly reports click https://daniels.du.edu/burns-school/ and scroll down to the REAL ESTATE MARKET CYCLE REPORT section on the Website. For the Q3 2020 report click https://daniels.du.edu/assets/Cycle-Monitor-20Q3.pdf
To learn more about Dr Glenn Mueller click https://daniels.du.edu/directory/glenn-mueller/
For commercial real estate practitioners, this is essential reading each quarter.
Ted
