Residential Electricity Costs and Sources of Electrical Generation by State
Electricity costs can be a significant monthly recurring expense for households. For some households, in high-heating and cooling requirement locales, approaching or exceeding $1,000 per month is possible. Electricity costs vary broadly from state to state just like economies and real estate markets. As usual the TINSTAANREM axiom is applicable — There Is No Such Thing As A National Real Estate Market or economy. The same is true with respect to electricity and other utility expenses. Total electricity costs are a function of rates per kilowatt hour (kWh) and the number consumed.
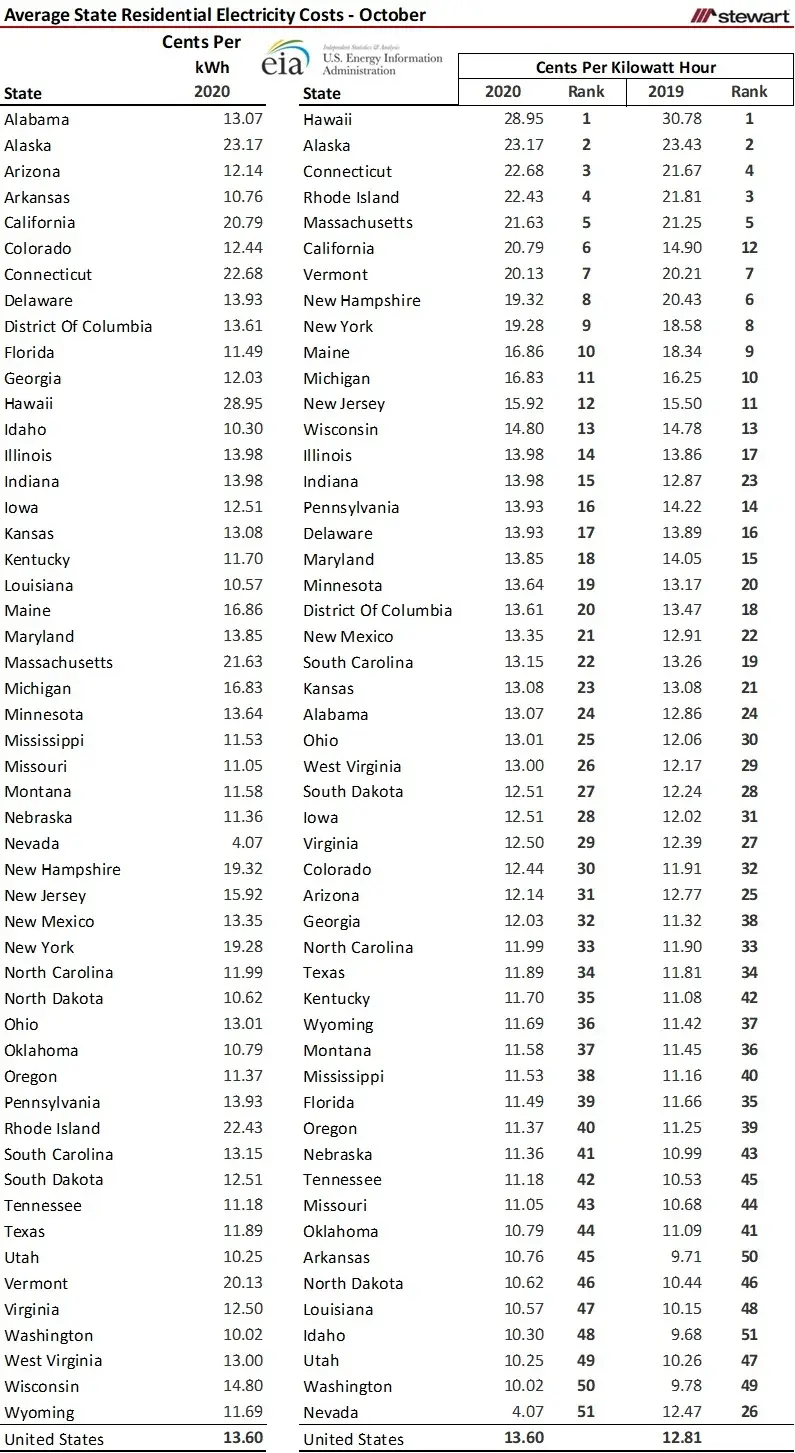
The U.S. Energy Information Agency (EIA) reports average electricity rates monthly by state. The following table shows the average residential electricity rates for October 2020 and October 2019 along with the percentage change between the two, ranked from high-to-low cost per kWh. Not surprisingly, given transportation and cost of doing business, Hawaii and Alaska came in with the top state electricity rates per kWh. In addition to being remote -- think transportation costs – Hawaii has no proven hydrocarbon reserves. The Aloha state generated more of its electricity from oil (70.1 percent in September 2020 according to the EIA) than any other state. All of that oil or refined product must be shipped from Alaska (3,000+ miles distance) or other countries. Alaska electricity costs are challenged by small, unconnected grids with extremely low population densities resulting in extraordinarily high distribution expenses. Despite Alaska’s current abundance of cheap oil and natural gas, electricity production and distribution costs are high. One last anomaly to address is the drop per kWh by 2/3rds in Nevada when comparing October 2019 to October 2020. NV Energy, the state’s primary supplier of electricity, filed the largest rate cut in the history of the state in June 2020. While residential electricity demand has risen in the pandemic across the U.S., use by
businesses has seen an overall decline.

Electricity generation is obtained from three primary sources – each with differing costs.
- Fossil Fuels
- Nuclear Electric Power
- Renewable Energy
Fossil Fuels
- Coal
- Natural Gas (_Dry_)
- Crude Oil
- NGPL (_Natural Gas Plant Liquids_)
Renewables
- Hydro-Electric Power
- Geothermal
- Solar
- Wind
- Biomass
- Wood and Wood-Derived Fuels
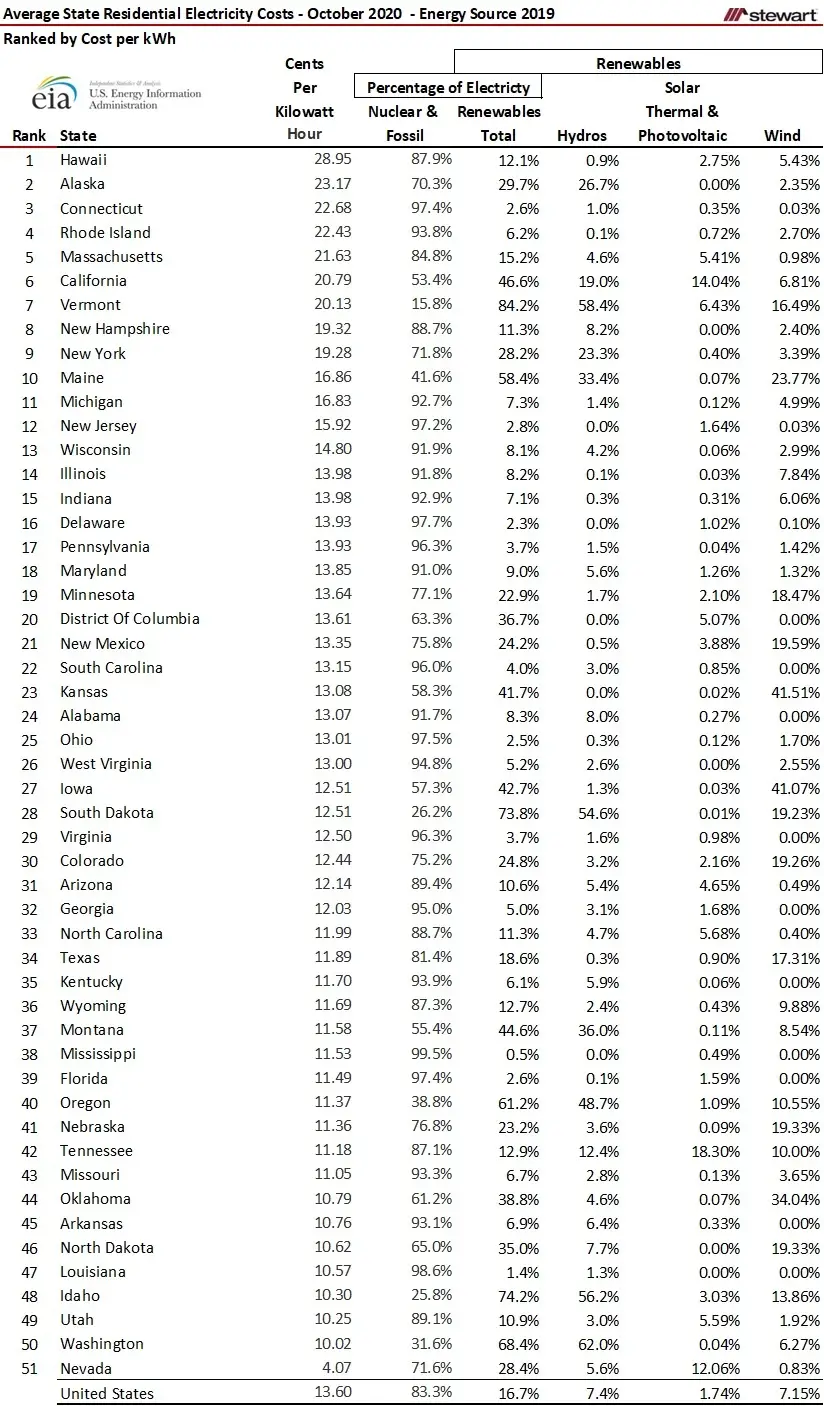
Source of electricity generation by state, based on the 2019 levels reported by the EIA, are detailed in the following table. The Renewables Total includes hydro, geothermal, biomass, wood, wind and solar-thermal & photovoltaic.

To view the EIA report for rates by state click
As the U.S. trends to replace historical fossil-fired fuels and nuclear-powdered electricity generation, costs per kWh will escalate. Hydros and nuclear-powered electricity, until now, have been considered the cheapest form of electrical generation once the facility had been constructed. The same is not true, however, using wind or solar for electrical generation given current pricing of uncompetitive storage costs. An article in IEEE Spectrum (trade magazine of the Institute of Electrical and Electronics Engineers) states that for wind and solar to be economically competitive for electrical generation requires battery costs to be in the $10 per kWh range. That is less than one-tenth the typical cost seen today. That said, battery costs have dropped almost 90 percent since 2010. Unknown is how much additional battery storage cost savings can be garnered.
