
State GDP Growth Q3 2020 to Q4 2020
Gross Domestic Product (GDP) is the value of all the goods and service produced. Along with job numbers, GDP is among the best indicators for economic performance. The U.S. saw the largest decline in GDP in history in Q2 2020 due to the pandemic, plunging 31.4 percent on an inflation-adjusted annualized basis. That was followed by the largest one-quarter gain ever of 33.4 percent in Q3 2020. The year finished out at a strong 4.3 growth (annualized) in Q4 2020 compared to the prior quarter.
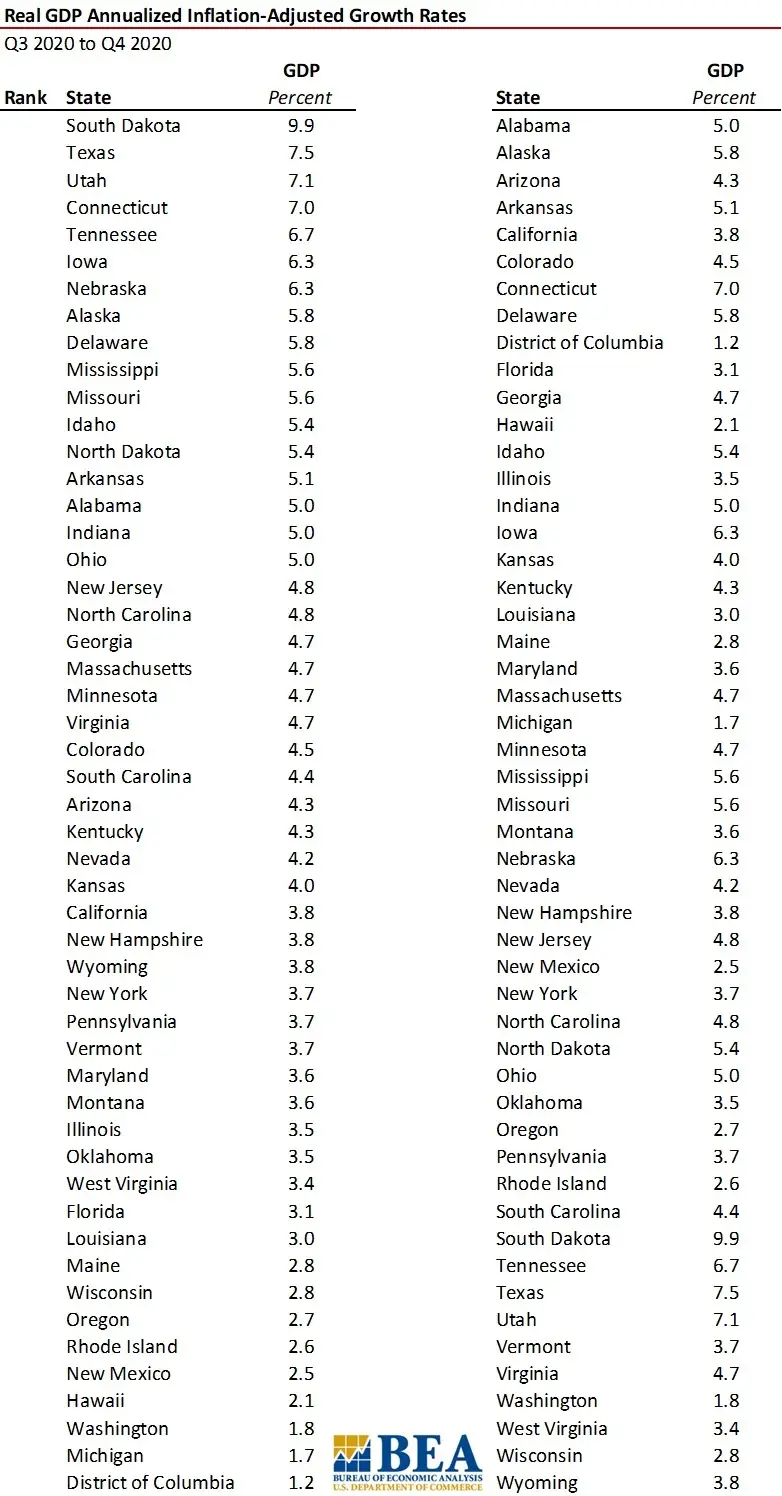
That growth rate, however, was not systemic across the country. The Bureau of Economic Analysis (BEA) just released Q4 2020 GDP growth rate for all 50 states and the District of Columbia. Though none posted a positive year-long GDP growth rate for all of 2020, each and every one notched growth from Q3 to Q4 in 2020. The table below details the Q4 growth rate (annualized and inflation adjusted) when compared to Q3 2020.
Types of businesses, tax laws, incidence of the pandemic, migration and varying government closures by state all combined to form the differences in GDP gains.
Keep in mind that GDP growth rates in 2020 did not include the economic benefit of the just-passed $1.9 trillion stimulus -- which alone is estimated to boost GDP 4 percent in 2021. Throw in the potential $3 to $4 trillion infrastructure and political spend now being proposed, and 2021 is looking up – as long as tax hikes and rising interest rates due to inflation and the massive increase in federal debt are ignored. Ted