MSA Job Performance Metrics March 2021
Jobs are everything to the economy and the ultimate demand for real estate. While the pandemic saw 22.4 million jobs disappear from February to April 2020, all but 8.4 million of those job numbers have been brought back in one form or another. The recovery, however, is neither uniform nor consistent across the country.
The data below detail Metropolitan Statistical Area (MSA) job metrics since February 2020 – the baseline prior to the pandemic. All data are from the U.S. Bureau of Labor Statistics (BLS), based on seasonally adjusted numbers allowing comparison across any month of the year. Though there are 384 MSAs in the U.S., seasonally adjusted data are available for 380.
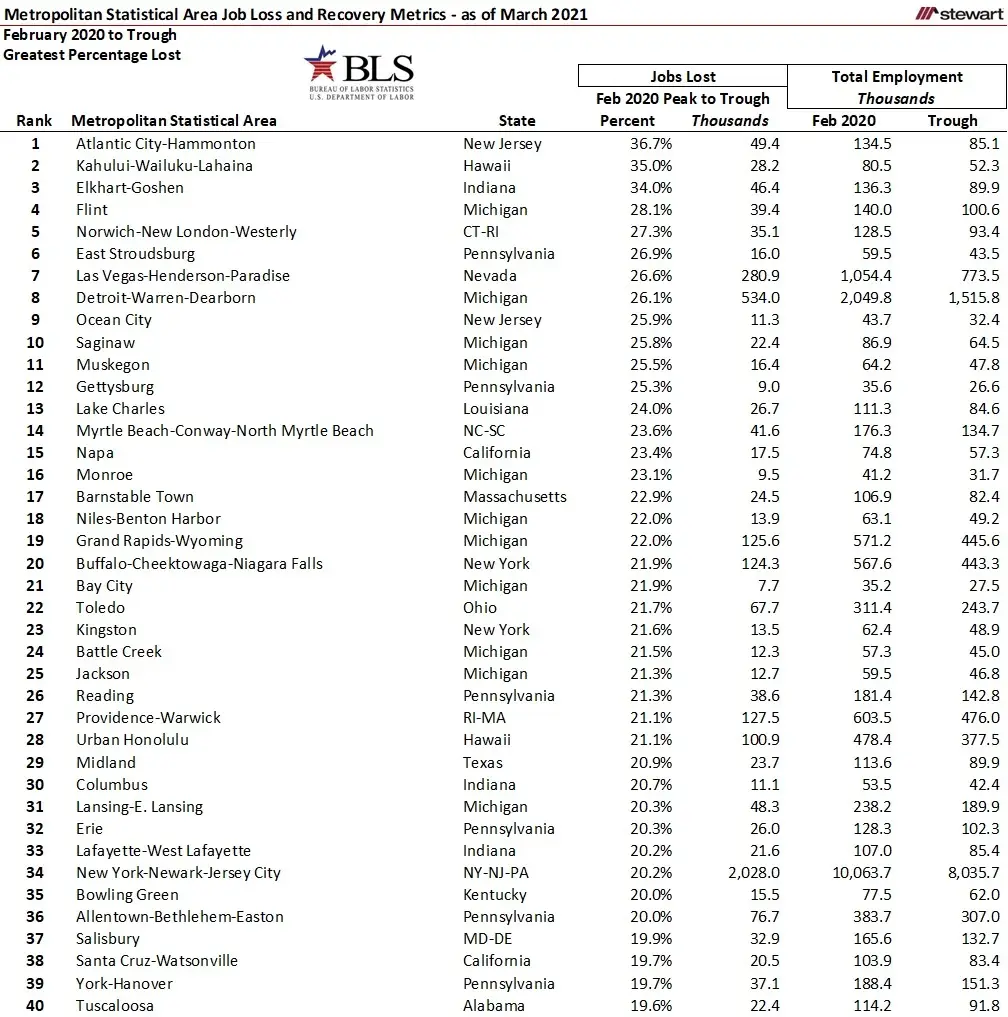
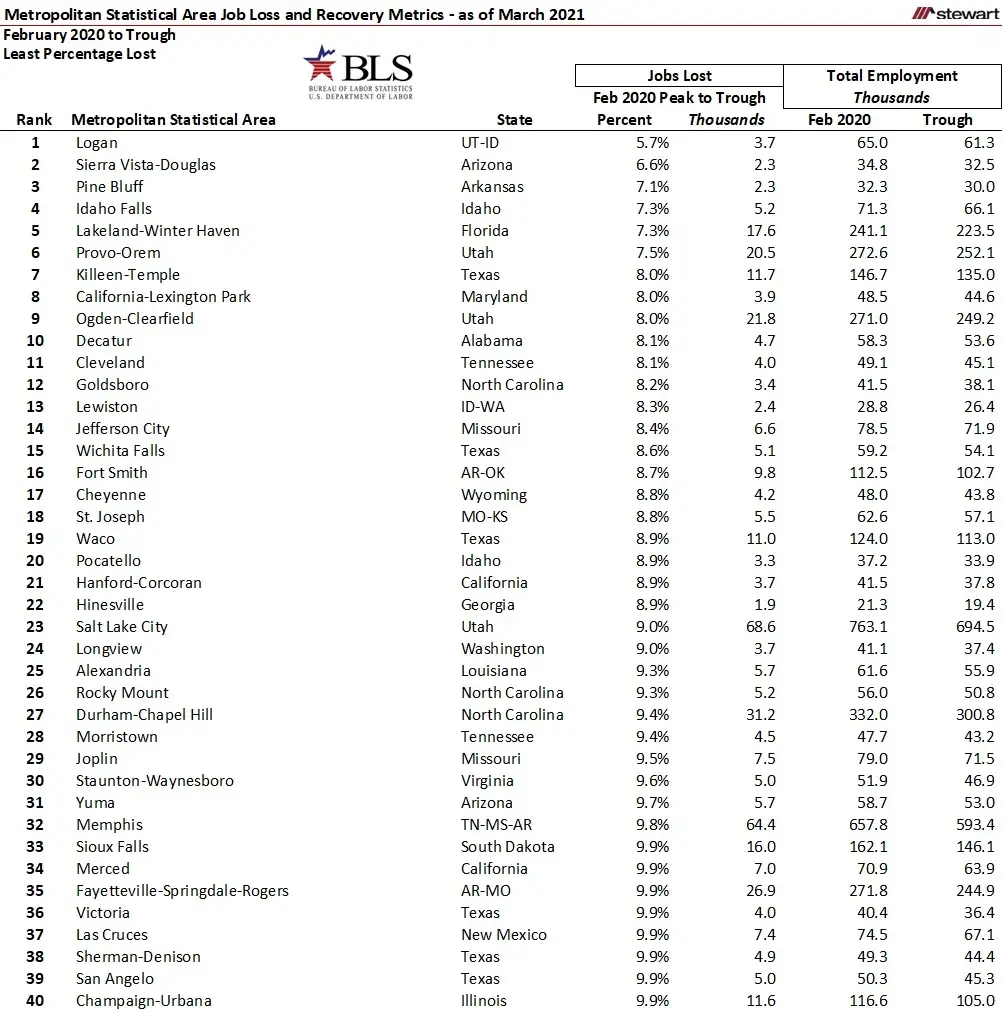
To appreciate what is happening in today’s job markets first requires a look at the massive plunge from February 2020 to the pandemic-driven employment trough. For most states and MSAs, the trough was hit in April 2020, but varied for many others. The first two tables show job loss percentages from February 2020 to the trough for the 40 MSAs down the least and greatest. While the 40 MSAs with the greatest percentage of jobs lost at the onset of the pandemic spanned from tiny (35,200 jobs total pre-pandemic in Bay City, Michigan to more than 10 million in New York-City-Newark and Jersey City), MSAs with the least percentage of jobs lost were smaller. Among the 40 MSAs with the smallest percentage of lost jobs, just two had pre-pandemic job counts greater than 300,000: Salt Lake City at 763,100 and Memphis with 657,800.
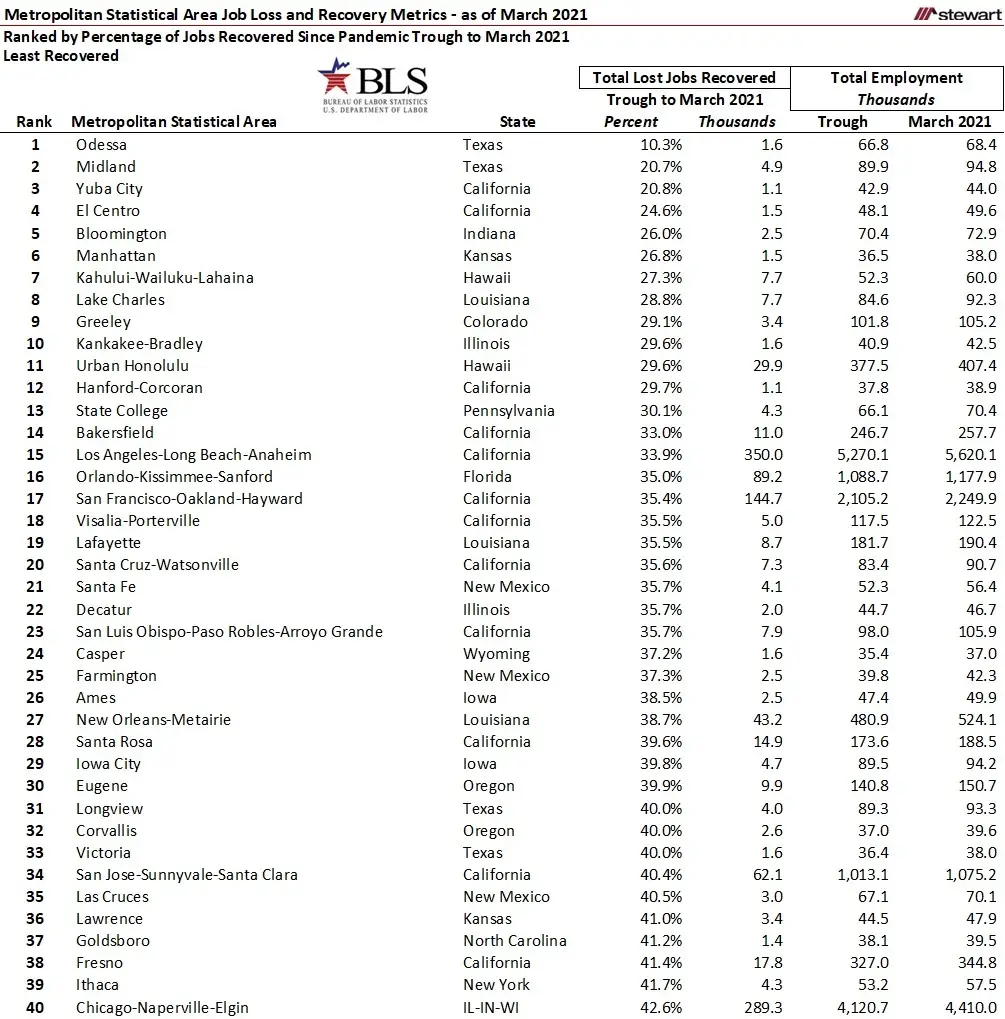
The next two tables show the 40 MSAs with the smallest and greatest percentage of lost jobs that have been recouped from the employment trough as of March 2021. Among those with the lowest recovery rates are MSAs either concentrated in oil and gas production, markets that had high employment in the Leisure & Hospitality Sector, or cities that faced extended government-mandated shutdowns. Within the high-job recovery MSAs are many markets that benefited from accelerating in-migration as the work-remotely aspect has freed many from where they must reside.

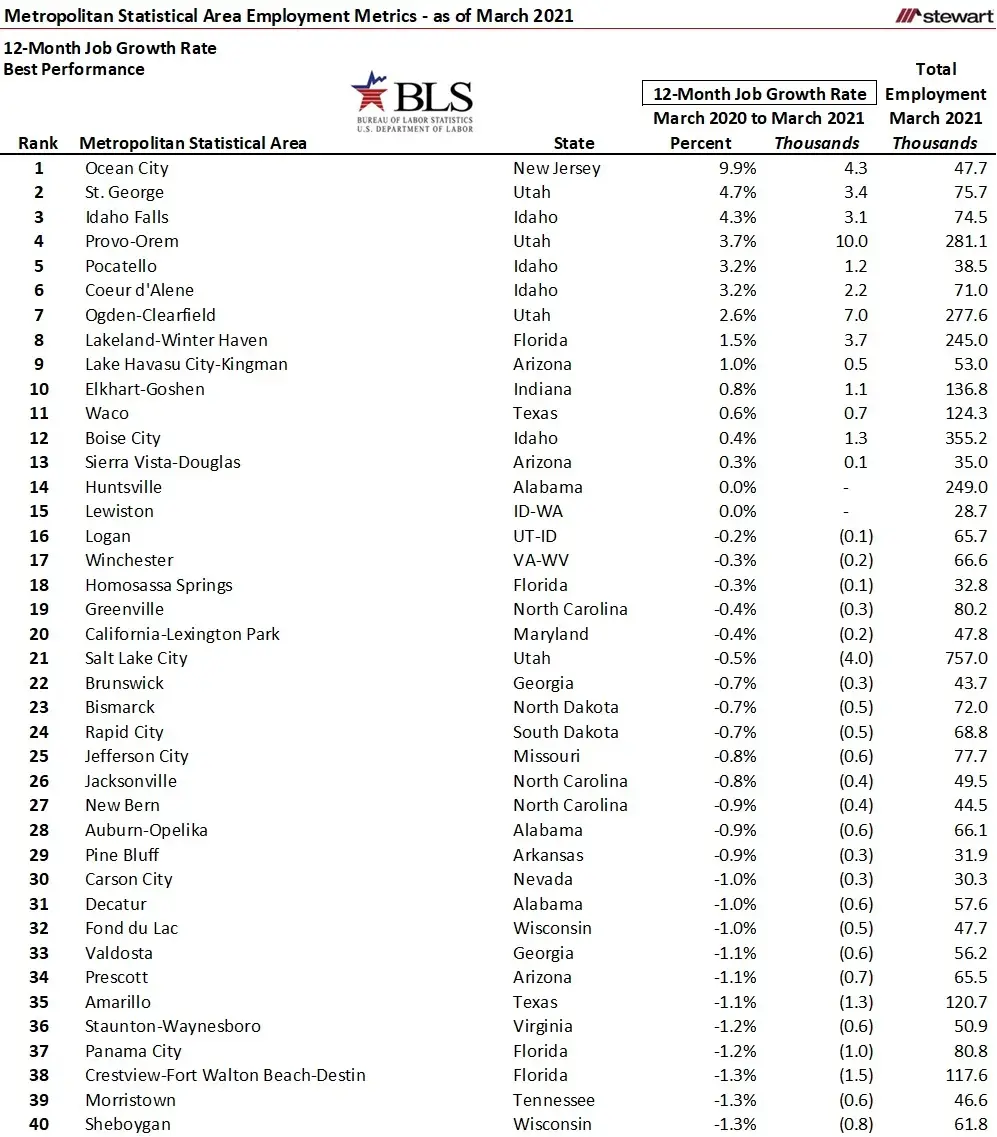
Job growth (or loss) for the 12-months ending March 2021 is detailed in the following two tables for the best and worst performing MSAs. Just 13 of the 380 tracked MSAs posted a 12-month gain in jobs and two registered no change, meaning that 365 posted a decline in total employment.

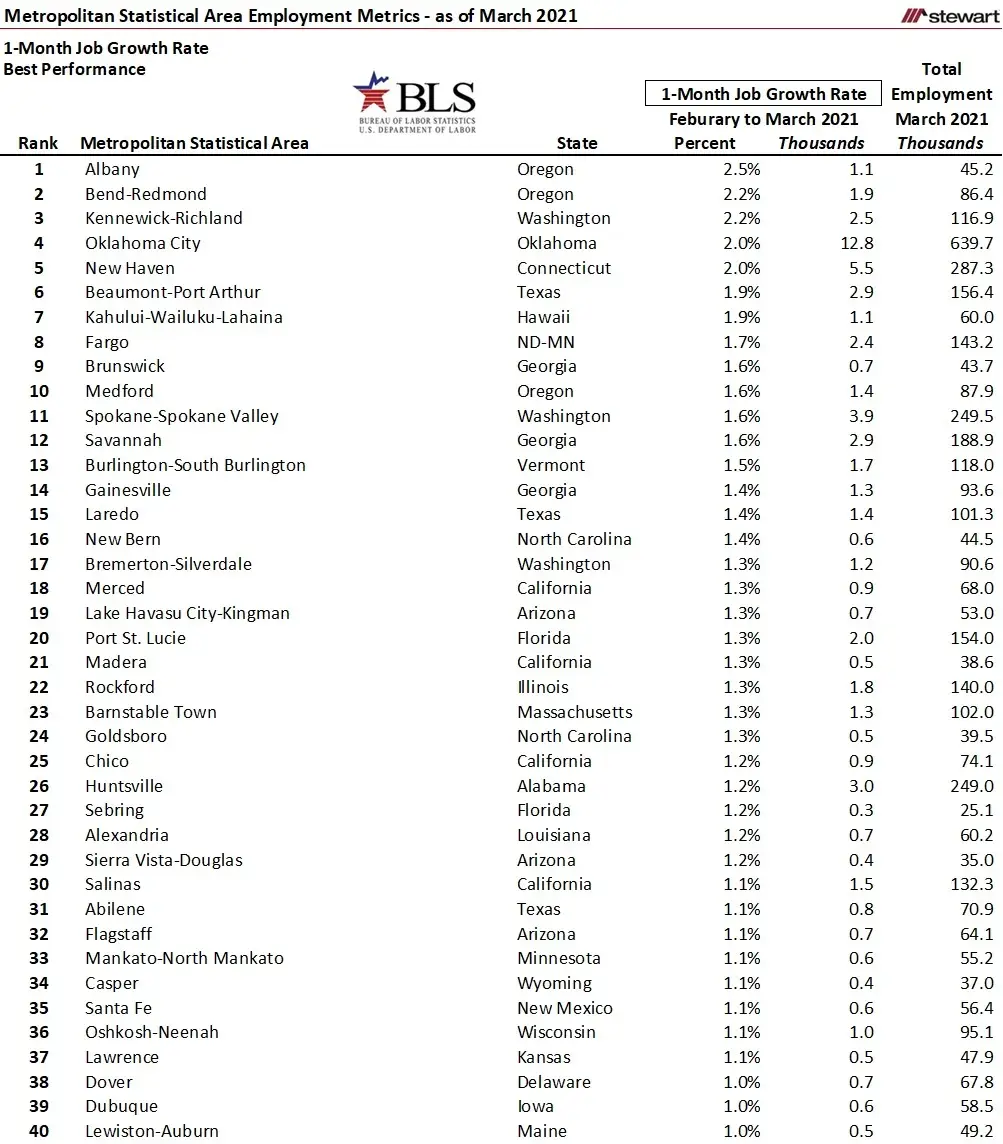
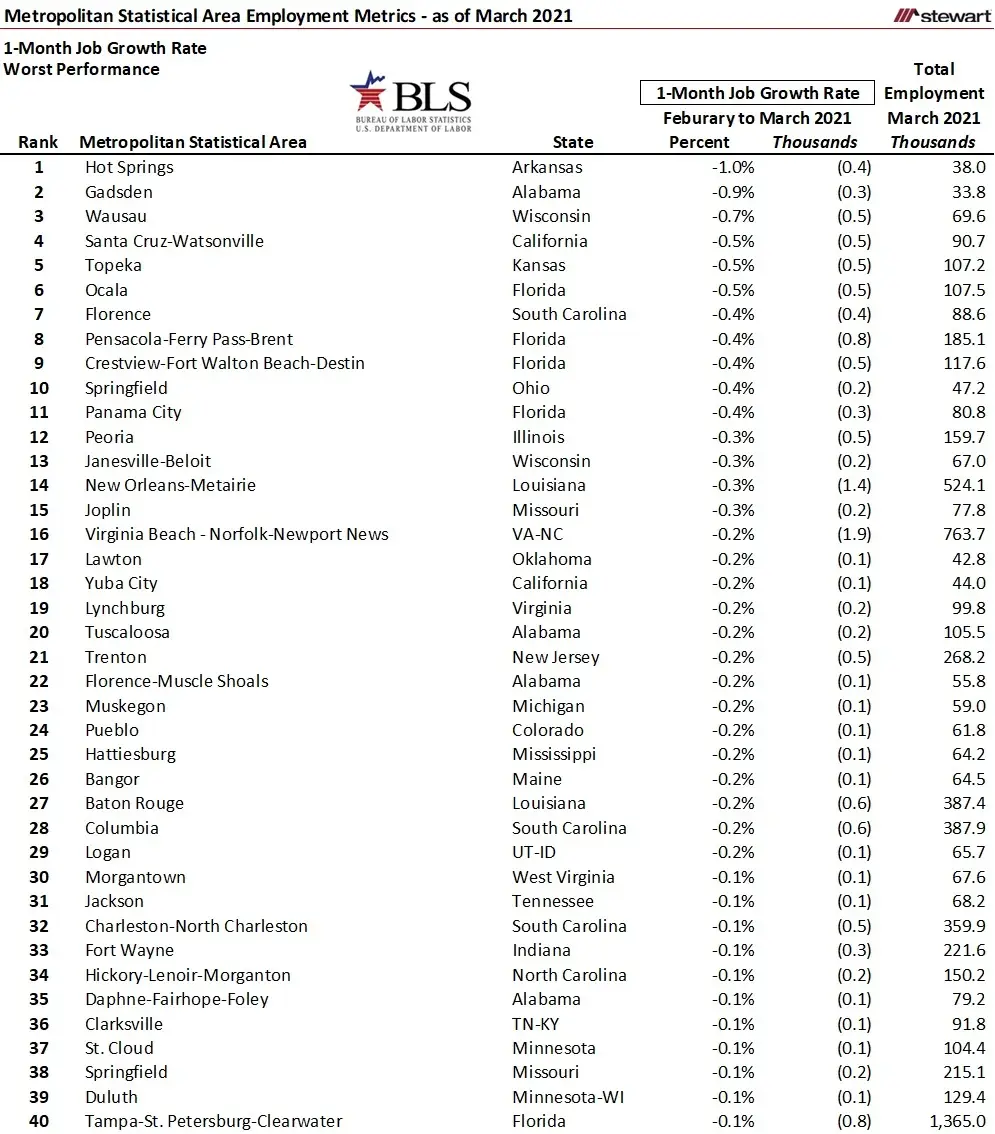
The final two tables show the 40 MSAs each with the best and worst 1-month change in employment from February to March 2021.
A plethora of employment related data are available from the BLS – click https://www.bls.gov/ and then the DATA TOOLS tab to explore.
Click here for a PDF that shows these metrics from all 380 MSAs having data available.
Good news is that the economy is coming back from the head-on collision with the pandemic. Bad news, at least for many MSAs, is that the recovery is minimal compared to the initial loss. It may be years before some MSAs reach the level of employment seen in February 2020 just prior to COVID 19.
Ted
