Existing Home Sales Stumble from March to April on Tight Inventory, But Median Price Jumps 19.1 Percent
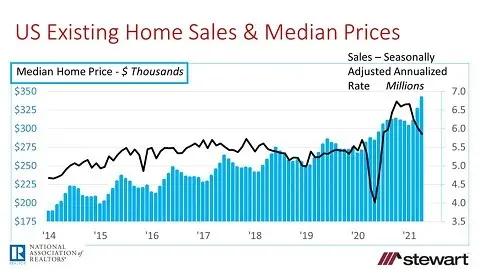
Existing home sales stumbled for the third month in a row, sinking from 6.01 million sales on a seasonally adjusted annualized rate (SAAR) in March of this year to 5.85 million in April, down 2.7 percent according to the National Association of Realtors® (NAR). The slip is attributed to limited inventory of listings available for sale in conjunction with strong demand. As a result, median existing home prices shot up 19.1 percent year-over-year to an all-time record $341,600. Average price jumped 13.6 percent to $364,800, also a record.
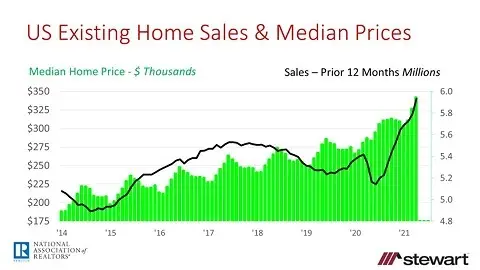
Existing home sales are shown from two different views in the following graphs with each including monthly median home prices. The first shows the SAAR of sales and the second is based on actual monthly closings (not seasonally adjusted), summed over the prior 12-months.


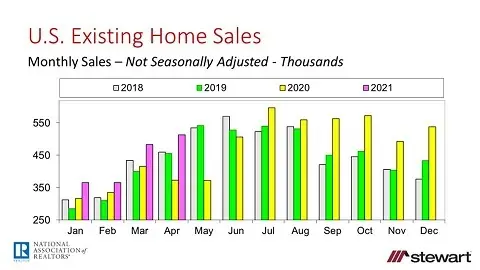
The bar chart shows monthly existing home sales (unadjusted) commencing in January 2019. Home sales plunged last year in April and May at the full onset of the pandemic, making comparisons year-over-year somewhat meaningless. As people stayed at home, where they lived became a greater impact on the overall quality of their lives and lifestyle than anytime in modern history, driving the intrinsic value of housing to a generational peak.

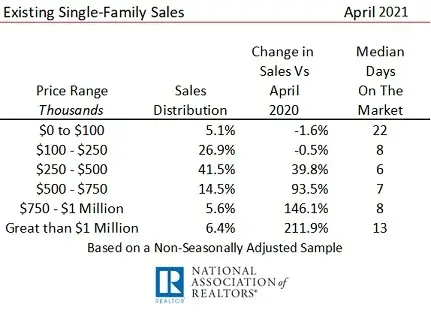
Consistent with the idea that housing has the greatest intrinsic value in our lifetimes is the more than tripling of the number of sales of homes closing for $1 million and up. Sales by price range are shown in the table based on a sample by NAR. The likely reason for the dip in sales priced less than $250,000 is a lack of inventory for sale. Just 5-years ago $1 million and up homes made up just 2.3 percent of all sales versus 6.4 percent today.

Other details in NAR’s press release included:
- Though the inventory of homes for sale rose 10.5 percent to 1.16 million active listings from March to April, it remained 20.5 percent less than one-year ago. At the current sales pace, there is an estimated 2.4 month supply (on an unadjusted basis, or 2.3 months on a seasonally adjusted basis), down from 4.0 months a year ago. Prior to the pandemic, a 6-month inventory was considered normal
- Individual investors and 2 nd -homebuyers bought 1-out-of-every 6 existing homes sold in April (17 percent), up slightly from 15 percent in March and 10 percent in April 2020
- Buyers paid all-cash for 1-in-every four closings in April (25 percent) compared to 15 percent one-year ago
- 1 st -time homebuyers, which in the past have historically made up 40 percent of all sales, acquired 31 percent of April 2021 sales
- One-year ago the typical home was on the market 27 days prior to signed acceptance of a purchase offer. That miniaturized to 17 days in April 2021, with 88 percent of all homes on the market less than 1-month prior to a contract
To read the full NAR press release on April 2021 sales click https://www.nar.realtor/newsroom/existing-home-sales-decline-2-7-in-april
To access NAR’s array of housing statistics click https://www.nar.realtor/research-and-statistics/housing-statistics
U.S. consumers have an estimated $2 trillion more money today in their banks accounts, pockets, billfolds and purses than 1-year ago. That is driving demand for everything – including homes at record prices. After all, it is all about supply and demand.
Ted
