Inflated New-Home Prices Punctures Sales Numbers - April 2021
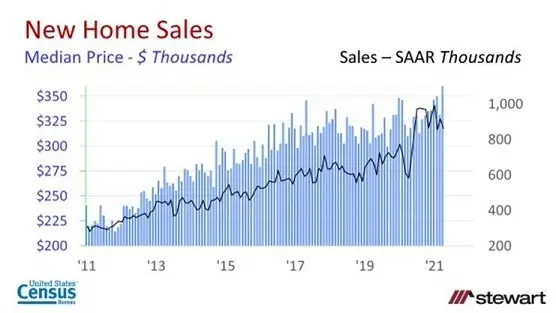
As new home sales prices inflated to a record high – with the median price in April 2021 at $372,400, up 12.6 percent from the prior month and up 20.2 percent year-over-year, the air was let out of the number of sales which dropped 5.9 percent from the prior month according to the latest data released by the U.S. Census Bureau. As sales deflated, inventory of homes for sale rose from 307,000 in March 2021 to 318,000 as of April on a seasonally adjusted basis, increasing the number of months of inventory available for sale from 3.6 to 4.4 months. Given the onset of the pandemic in April 2020, year-over-year comparison of the percentage change in sales is relatively meaningless.
New home sales and median prices are shown in the following graph monthly from January 2011 -- commencing at the trough in home sales following the implosion of the housing bubble.
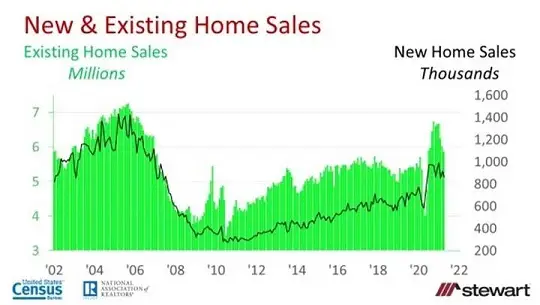
New and existing home sales do change significantly over time as shown in the following graph, but generally in unison. Neither new or existing home sales have recovered to the peak levels seen in 2005. New home sales are counted differently than existing home sales. An existing home sale is counted when the property transaction closes and the ownership transfers from one party to another. New home sales are counted when a purchase contract is signed. Some new home sales have not even yet had a building permit issued and may be a year-or-more out from completion. As a result, new home sales data are revised monthly, sometimes with large changes.
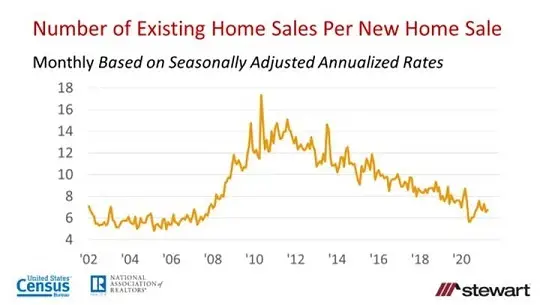
Since 2002 there has been an average 8.9 existing home sales per new home transaction (8.7 median) but this varies significantly across time as shown in the following graph. The fewest existing home sales per new home sale transaction since 2002 was 5.0 in October 2005 – essentially the top of the housing bubble if defined using the number of sales. Following the housing market trough, a peak 17.4 existing home sales per new home transaction was tracked in May 2010. April 2021 saw 6.8 existing home sales per new home sale.
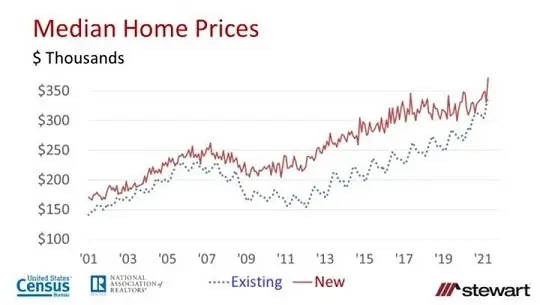
Median prices for both new and existing home sales are detailed in the next graph. Note the seasonal variation in existing home sales as these data series are not adjusted for the month of sale.
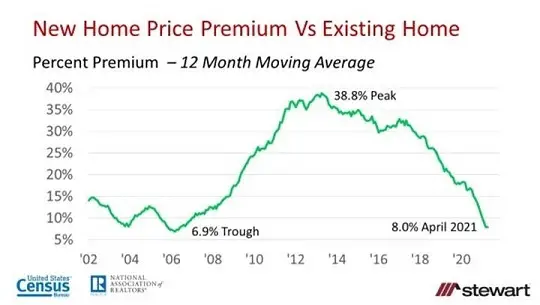
The typical percentage premium paid for new homes is shown in the last graph. It was calculated by subtracting the 12-month average existing median home price from the 12-month average new home median price, and then dividing by the average 12-month existing home median price. Using the 12-month moving average sheds the seasonality impact observed in home prices. The average new-home price premium since 2002 was 22.1 percent, with a trough of 6.9 percent at the peak of the housing bubble and a 38.8 percent peak in April 2013. In no way is there an inference that the typical new home is similar in size, amenities and features of the typical existing home. The only metric that is being compared is median price.
Builders continue to face multiple head winds including:
- A tripling of lumber prices since April 2020, results in the price of a typical new single-family dwelling to increase by $35,872 according to the NAHB
- The total deficiency of construction workers rose to 309,000 in January 2021 with 60 percent of builders reporting a worker shortage per the NAHB
- The New Home Lot Supply Index from housing analytics firm Zonda fell 10 percent in Q1 2021 to a record low, with approximately 242,000 homes with authorized building permits yet to have commenced construction
- An estimated 47 percent of contractors added escalation clauses to new home purchase contracts per an April 2021 survey by the National Association of Realtors®
- The cost of government regulation in a typical new home in 2021 accounted for $93,870 of the total $394,300 average price
While there remains 9.8 million unemployed across the U.S., as a group Americans have $2 trillion more today in their bank and savings accounts, purses and billfolds and pockets compared to one year ago, and that, despite the rapid rise in home prices, is driving the effective demand for housing, albeit at a slower rate.
To read the latest new home sales press release from the U.S. Census Bureau click https://www.census.gov/construction/nrs/pdf/newressales.pdf
Ted
