New Home Sales Ongoing Multiple Headwinds – August 2021
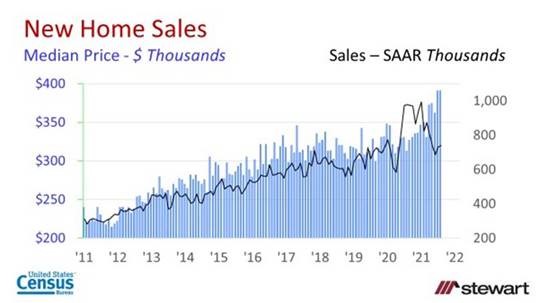
New home sales continued to be buffeted by multiple headwinds in August 2021. Those headwinds included restricted vacant developed lot availability, lack of skilled workers, materials shortages and escalating costs. Unfortunately these economic weather patterns are not likely to soon dissipate. Though likely to be revised, new home sales were down 24.3 percent year-over-year in August 2021 while the median price was up 25.0 percent.
Total new home sales and corresponding median prices are shown in the graph. Sales are based on a seasonally adjusted annualized rate (SAAR) while median prices are not seasonally adjusted as reported by the U.S. Census Bureau.
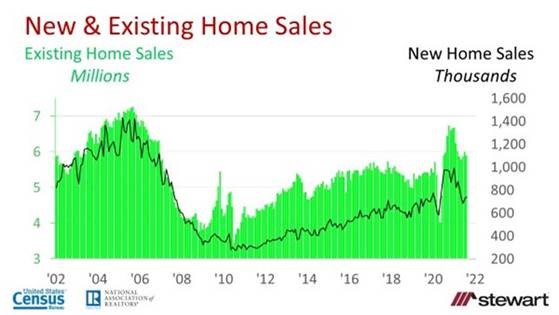
New home sales are counted differently compared to existing home sales. A new home sale is defined as a signed purchase contract – even if construction has yet to commence. Since contracts do fall through, new home sales metrics are subject to multiple revisions. Existing home sales are counted when the property closes and ownership transfers. The next graph shows new and existing home sales on a SAAR monthly commencing 2002.
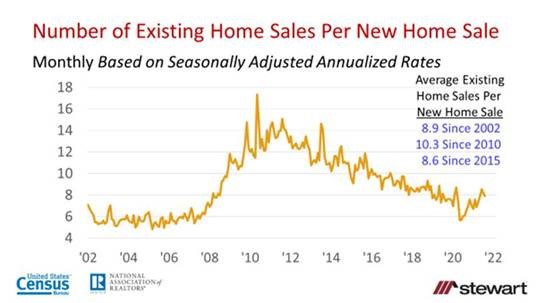
The number of existing homes sold per new home sale are shown in the next graph. Since 2002 there was an average 8.9 existing home sales per new home. Shortening that interval from 2010 to August sees 10.3 existing home sales new home sale and contracting that to 2015 to date yields an average 8.6 existing home sales per new home transaction.
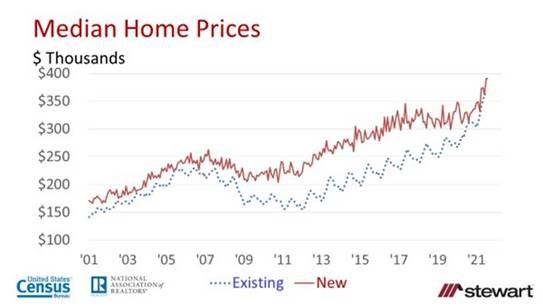
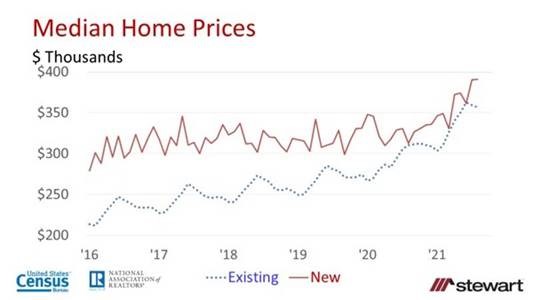
Monthly median prices (not seasonally adjusted) for new and existing homes are shown in the next two graphs. The first graph spans 2001 to date and the second (with the same data) covers 2015 to date. The price convergence in months since 2020 was more a function of builders switching from move-up markets to entry level housing for housing-hungry first-time homebuyers. The massive demographic demand by Gen Z and Millennials will see this continue in coming years.
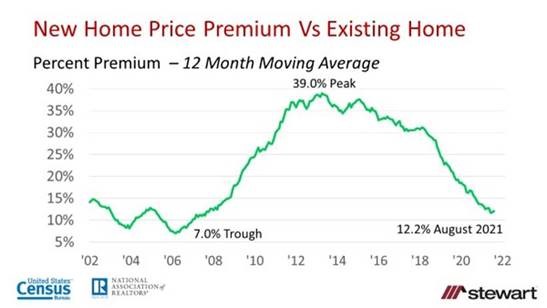
New home price premiums are shown in the next graph using 12-month moving median price averages to remove the seasonality effect historically prevalent in existing home sales. Since 2002 this premium has ranged from a low of 7 percent at the top of the housing bubble to a 39 percent peak. The 12-month moving average premium was 12.2 percent as of August 2021.
Census New Home Sales data
Census New Home Sales press releases
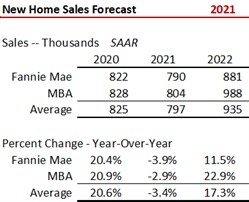
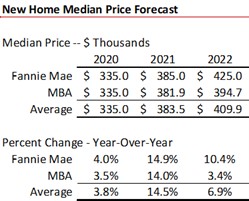
The latest forecast as of September 2021 for new home sales and prices from Fannie Mae and the MBA are detailed in the last two tables. While both see rising sales in 2022, the MBA expects that increase to be double Fannie Mae’s forecast. That flips on median price expectations, however, with Fannie Mae essentially expecting new home prices to increase at three-times the gain forecast by the MBA.
Just like the weather, new home sales data eventually change – even if just looking at historical data revisions. Still, housing demand continues to outstrip supply portending rising prices. This will continue until affordability, squeezed by rising prices and interest rates, literally prices people out of the homebuyer market.
