Difficult Headwinds For New Home Sales - October 2021
New home sales are completely different from a data perspective when compared to existing home sales. An existing home sale is counted when the ownership is transferred from one party to another. New home sales, however, are counted when a home purchase contract is signed - often prior to construction being completed, and in some instances before building even commenced. As a result, revisions on past sales data are often huge and not necessarily an indicator of actual closing dates. The source of data for new sales is the U.S. Census Bureau versus the National Association of Realtors® for existing home transactions.
New Home Sales – October 2021Box Score
As of September 2021
Seasonally Adjusted Annualized Sales Numbers (SAAR)
800,000 SAAR as of September 2021
up 14.0 percent sequentially from August 2021 from 702,000
down 17.6 percent year-over-year from 971,000 in September 2020
Monthly Sales _– raw data not seasonally adjusted_
65,000 for the month of September 2021
up 14.0 percent sequentially versus the 57,000 sales in August 2021
down 15.6 percent versus the 77,000 sales in September 2020
Median Price – September 2021
$408,800 – _not seasonally adjusted_ up 18.7 percent vs $344,400 September 2020
Average Price – September 2021
$451,700 – _not seasonally adjusted_ up 11.5 percent vs $405,100 recorded in September 2020
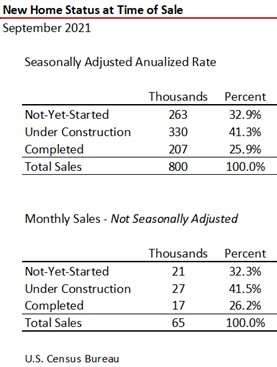
Home Status at Time of Contract
For both the Seasonally Adjusted Annualized Rate (SAAR) and the latest month, approximately one-out-of-every-three new home sales had not yet started construction and one-out-of-every-four were completed at the time of sale. Four-out-of-ten were under construction when the contract was signed.
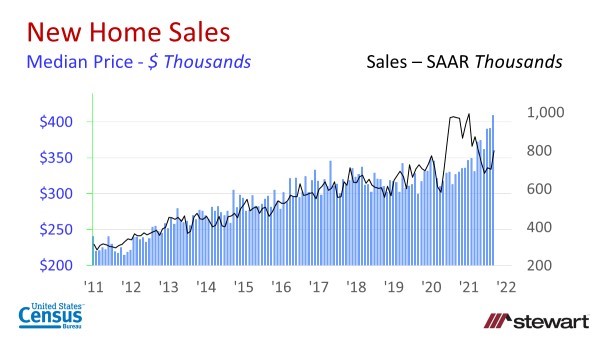
Graphs
First graph shows new homes sales (on a SAAR) and corresponding new home median prices (not seasonally adjusted) commencing monthly since January 2011.
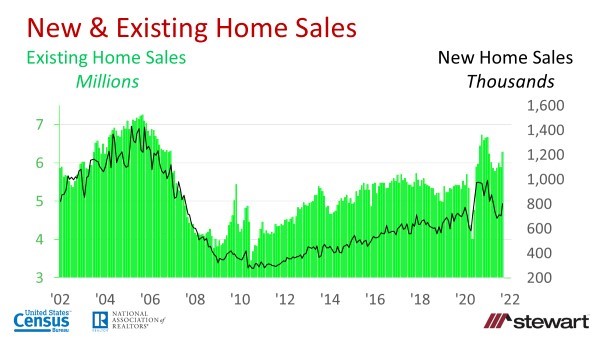
New and existing home sales on are shown since 2002 on a SAAR.
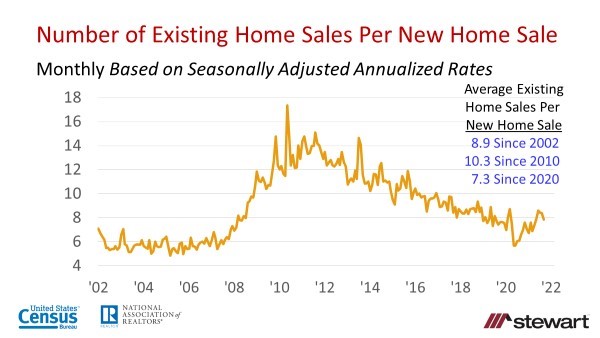
The number of existing homes sold per new home sale are shown in the next graph. Since 2002 there was an average 8.9 existing home sales per new home transaction. Shortening that interval from 2010 to September 2021 sees 10.3 existing home sales per new home sale and contracting to 2020-to-date yields an average 7.3 existing home sales per new home transaction.
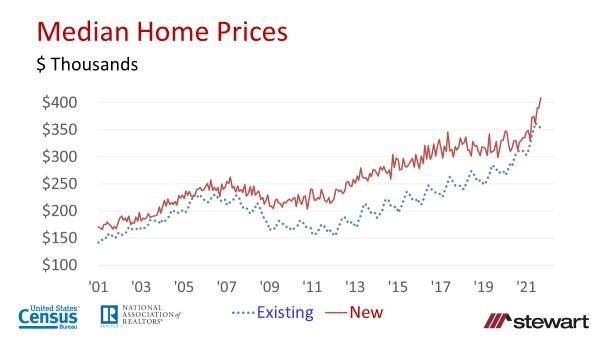
New and existing homes monthly median prices (not seasonally adjusted) are shown in the next two graphs. The first graph spans 2001 to date and the second (with the same data) covers 2016 to date. The price convergence in months since 2020 was more a function of builders switching from move-up markets to entry level housing for housing-hungry first-time homebuyers. The massive demographic demand by Gen Z and Millennials will see this continue in coming years provided builders can overcome the headwinds of limited lot availability, materials and labor shortages and exploding costs.
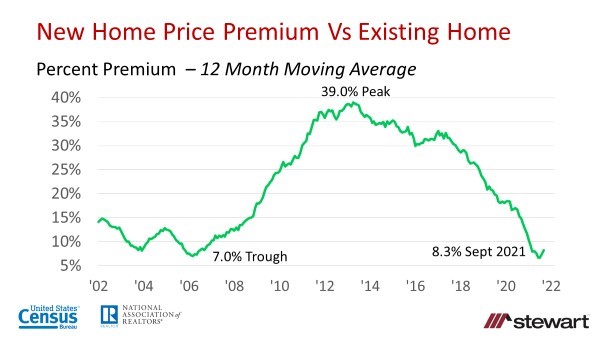
New home price premiums are shown in the next graph using 12-month moving median price averages to remove the seasonality effect historically prevalent in existing home sales. Since 2002 this premium has ranged from a low of 7 percent at the top of the housing bubble to a 39 percent peak. The 12-month moving average premium was 8.3 percent in September 2021.
To view Census New Home Sales data click https://www.census.gov/construction/nrs/historical_data/index.html
For New Home Sales press releases from the Census click https://www.census.gov/construction/nrs/index.html
My expectation is for builders to shift towards higher-end bigger-dollar construction given the several headwinds faced today on lots, materials, labor and costs. New entry-level housing construction is going to be muted for a few years as builders focus their limited resources on higher-profit options.
