
Job Numbers Back to Pre-Pandemic Numbers in 70 Metros - 310 Still Lag

Good news is that 70 of the Metropolitan Statistical Areas (MSAs) as of November 2021 now have as many or more jobs than in February, 2020 – the month prior to the pandemic. Bad news are the 310 MSAs still short of employment numbers compared to before the COVID19 outbreak according to data from the U.S. Bureau of Labor Statistics (BLS) using seasonally adjusted numbers.
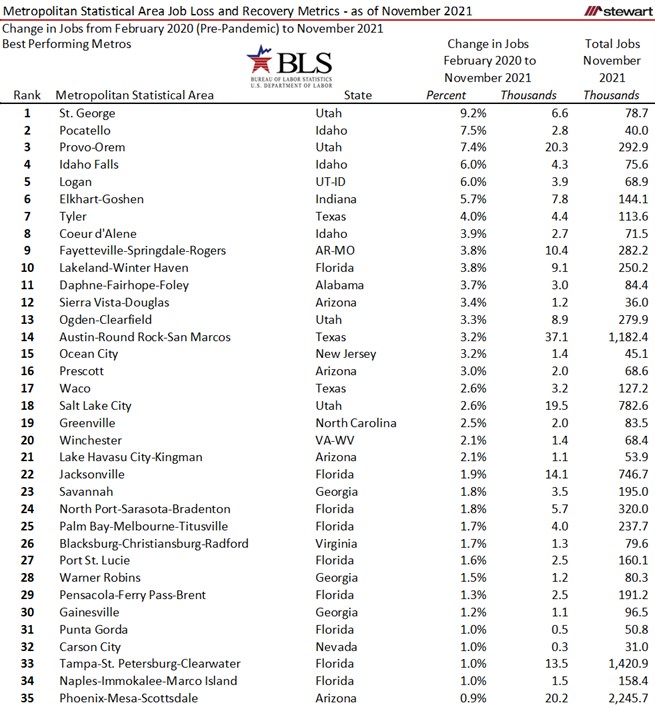
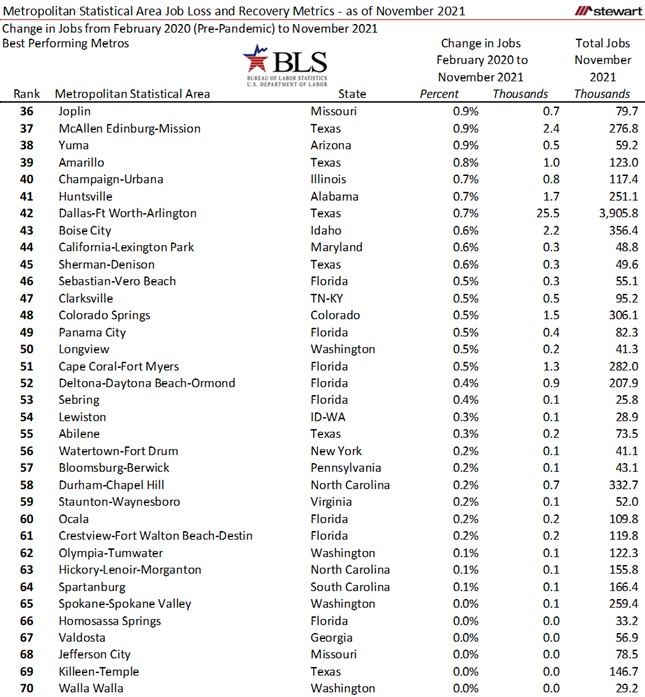
The two tables below show the 70 MSAs that at least returned to the number of jobs that existed in February 2020 as of November 2021. Among the 70 MSAs deemed as recovered (with a 0.0 percent or greater number of jobs), 58.6 percent (41) were located in five states. Impressive are Idaho and Utah in which every MSA in both states now have more jobs than before Coronavirus. Florida has an impressive 17 MSAs out the 22 across the state (77.3 percent) with more jobs than anytime in history.
17 Florida out of 22 MSAs statewide 9 Texas out of 25 MSAs statewide 5 Idaho out of 5 MSAs statewide 5 Arizona out of 7 MSAs statewide 5 Utah out of 5 MSAs statewide
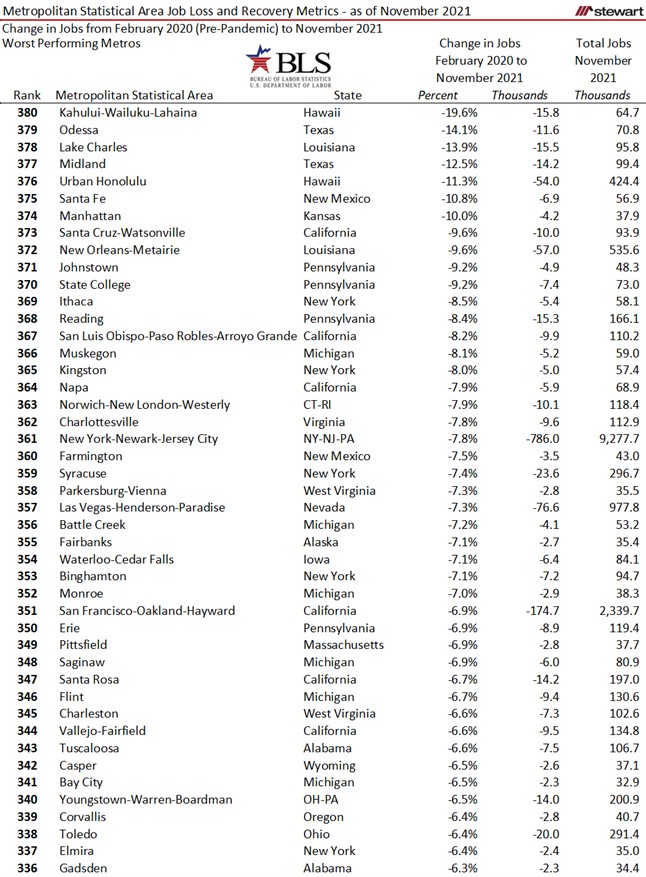
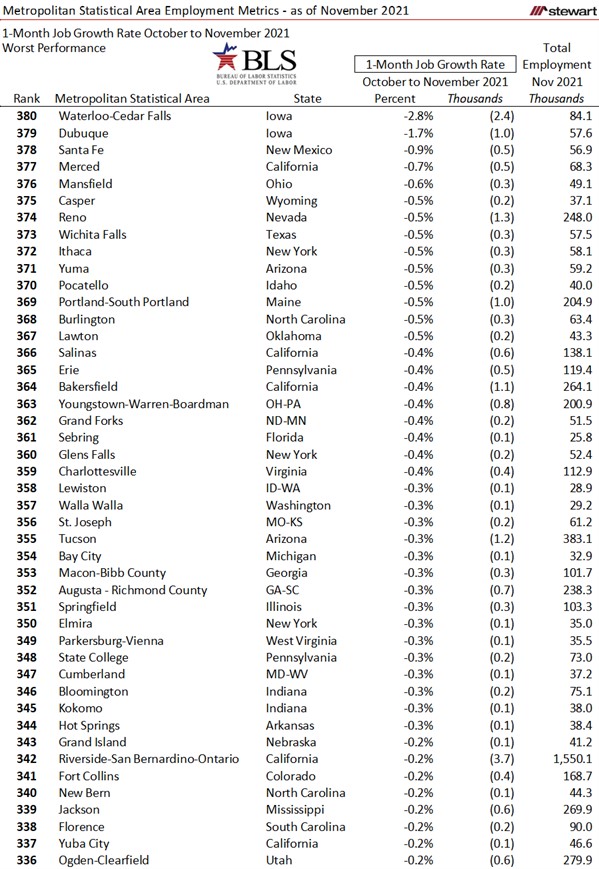
The 45 MSAs with the worst job performance from February 2020 to November 2021 are listed in the next table. Among the 45 worst performing job metros, the following states dominated:
6 California out of 26 MSAs statewide
6 Michigan out of 14 MSAs statewide
6 New York out of 12 MSAs statewide
4 Pennsylvania out of 18 MSAs statewide
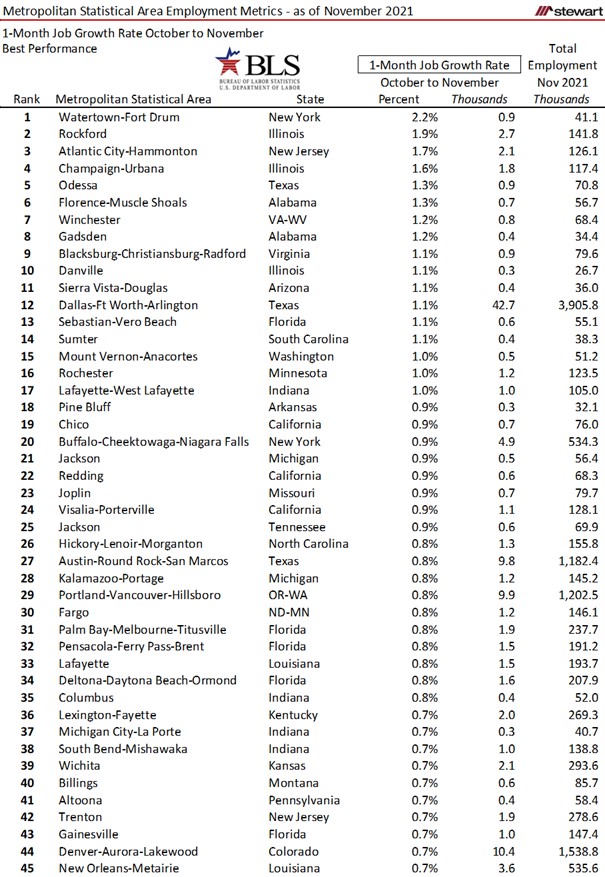
The latest best and worst 1-month job growth rates for the 45 top and bottom MSAs are detailed in the next two tables. Some of the worst one-month performing job markets are among the most recovered job markets since the pandemic across the country.
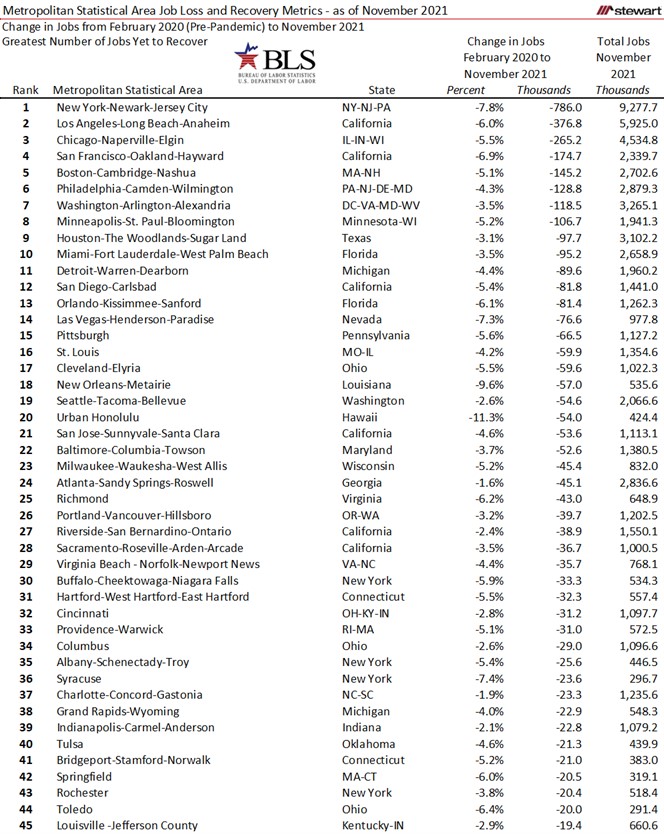
The 45 MSAs with the greatest number of lost jobs as of November 2021 compared to before the pandemic are detailed in the last table. The 10 MSAs with the greatest number of missing jobs account for more than one-half (58.7 percent) of the 3.91 million jobs still missing. The top 20 represent 3-out-of-every-4 jobs that are no more since the pandemic (76.1 percent).
View the PDF that details all 380 MSAs (with data available monthly from the BLS) with the following metrics:
- Jobs lost from February 2020 (the month prior to the pandemic) to the trough
- Percentage of lost jobs since recovered as of November 2021
- 1-month job growth rate
- 12-month job growth rate
- Job growth rate from February 2020 to November 2021
- Total number of jobs (thousands) as of November 2021
To explore the myriad of employment data available visit the BLS at https://www.bls.gov/data/
While several MSAs may see a relatively quick-return in coming months to pre-pandemic employment levels -- 36 are within 1 percent of pre-pandemic job numbers -- others may take years to return to the number of jobs counted in February 2020 depending on the type of jobs, migration rates and even state and local taxes. Some may never – at least in our lifetimes – get back to peak jobs. The Detroit MSA, for example, peaked at 2,211,400 jobs in June 2000 and had shrunk to 2,049,800 in February 2020 as auto manufacturing migrated elsewhere across the globe. The Youngstown, Ohio MSA peaked in jobs in December 1999 at 258,100 but had slipped to 214,900 by February 2020, a loss of 22.2 percent. There are many job-growth MSAs today, but also others still in insipient declines.
Ted