
U.S. Census Estimated Population Change 2020 to 2021 -- by State

While population gain alone does not guaranty economic growth, changes from one-year to the next in general shows where people are departing and where they (and their jobs) are landing. Fortunately, the U.S. remains among the few economically developed countries that continues to enjoy population growth. From 2020 to 2021 U.S. population grew from 331,501,080 to an estimated 331,893,745 according to the Vintage population estimates just released by the U.S. Census Bureau. Unfortunately, the estimated population gain of just 0.1 percent was smallest annual percentage increase in the history of the U.S.
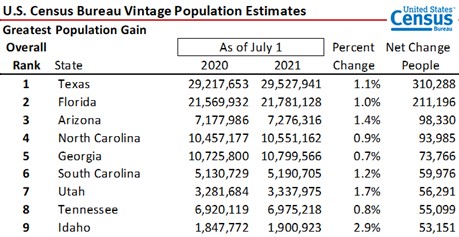
The 2020 Census serves as a foundation for 2021 Vintage population estimates which then incorporates data from births, deaths, and both domestic and international migration information. Just as with job growth from one state to another, population change varies across the country. The first table shows the 10-states with the greatest percentage growth in population from 2020 to 2021 and the second table the 10 states with the largest percentage decline. Included in the ranks are all 50-states and the District of Columbia. Just as Idaho is far-and-above the biggest population gainer at 2.9 percent, the District of Columbia hands-down had the largest decline in population losing 2.9 percent of its people in 12 months. Among the 50 states and District of Columbia, 17 posted a one-year decline in population, three had no change (0.0 percent) and 31 recorded at least a 0.1 percent gain.

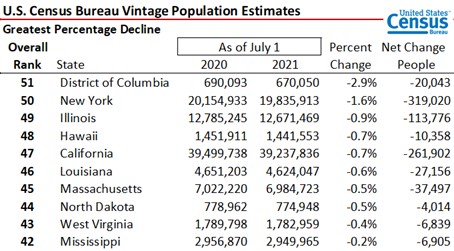
The next two tables show the states with the greatest change (up and down) in population from 2020 to 2021. Texas, with the largest one-year net gain in population (up 310,288) almost accounted (numerically speaking) for all New York’s decline of 319,020 in 2021.

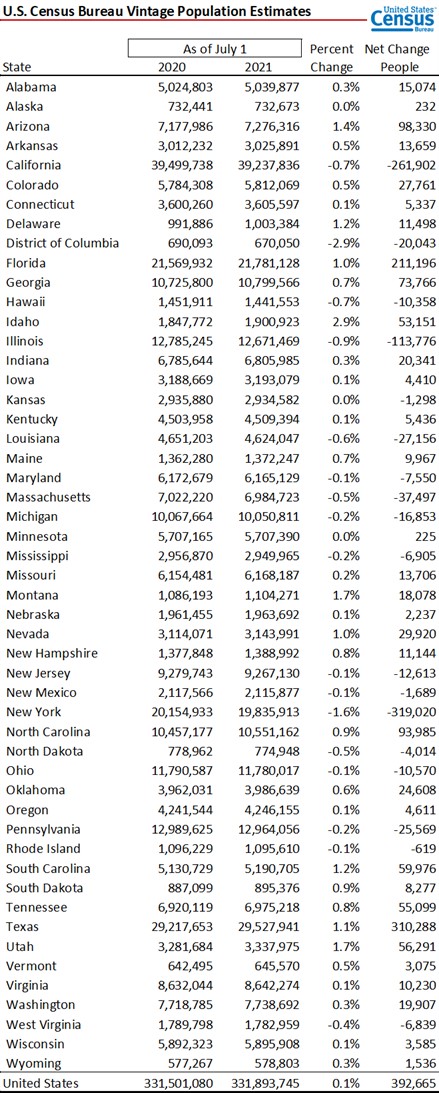
Data for all 50-states, the District of Columbia and the U.S. are shown in the next table.
Click here to read the press release from the U.S. Census Bureau on Vintage population estimates.
Click here for discussion on the methodology for Vintage population estimates.
While population growth (or loss) does not automatically correlate to job changes, the last table shows the relative population change rank from 2020 to 2021 along with the ranking of job growth from February 2020 (the month prior to the pandemic) through November 2021. These are sorted by population growth rates and are highly correlated and statistically significant. For those into statistics, the Pearson Product Moment Correlation Coefficient is 0.67813 and the Spearman Rank Correlation Coefficient 0.68581 with each having a P-Value of less than 0.00001. In plain speak this means that for most states, those with population gains also had strong job growth while population declines went along with weak job gains or literal losses. There were outliers to these statements, however. Nevada, for example, with a population growth rate of 1.0 percent (9th best overall) had the 6th worst (45th best) job performance from pre-pandemic (February 2020) through November 2021. This may be due to people exiting California and heading to Nevada and either starting their own companies (which are not immediately counted in jobs) or they are simply retiring there given favorable taxes. Nevada is one of seven states without a state income tax and ranked 7th best in the Tax Foundation’s 2021 State Business Tax Climate Index.

There always have been winners and losers on demographic and economic factors, but the pandemic has accelerated these changes across the country. Change is inevitable, but the rate and direction varies across the economic landscape and time.