
Commercial Real Estate Cycles Across 54 Metros - Q4 2021, Dr Glenn Mueller

The demand for commercial real estate continues to evolve with a changing economy, state of the pandemic, and now global conflicts. While some property types and markets struggle, others are booming. Detailed market-specific insight is critical to ascertain where individual real estate markets are currently at and where they are heading.
Dr Glenn Mueller’s quarterly Commercial Real Estate Cycles report gives just that perspective on what is going on in commercial real estate across the country with specifics for 54 metros for apartments, industrial, office and retail properties. Dr. Mueller defines four distinct phases in the commercial real estate cycle providing decision points for investment and exit strategies. Long-term occupancy average is the key determinant of rental growth rates and ultimately property values. Ideally, Phase 2 - Expansion is the ideal quadrant for real estate investor performance as shown in the following two graphs and discussion.
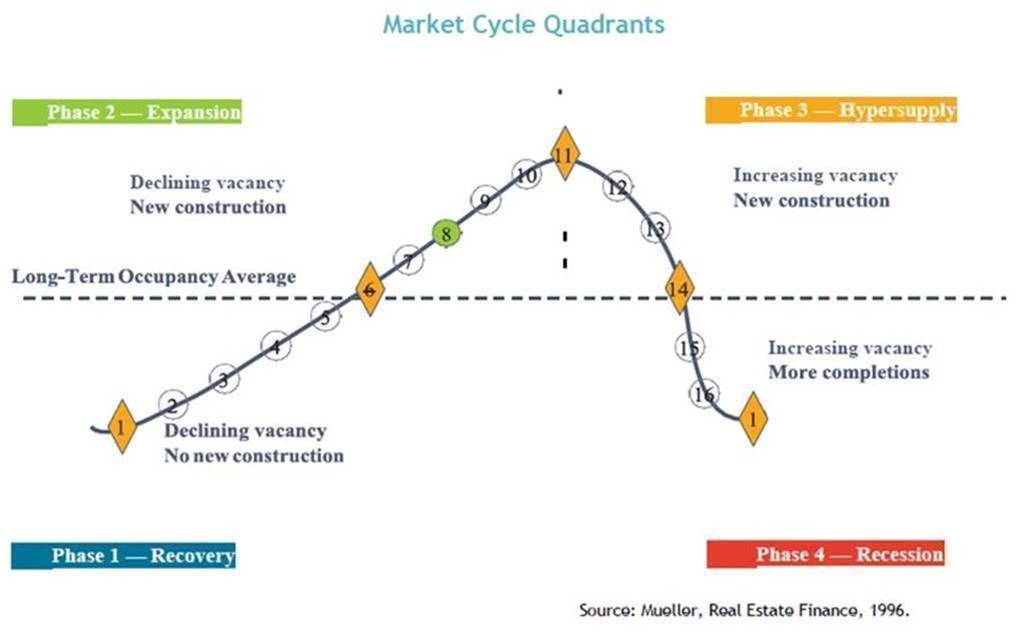
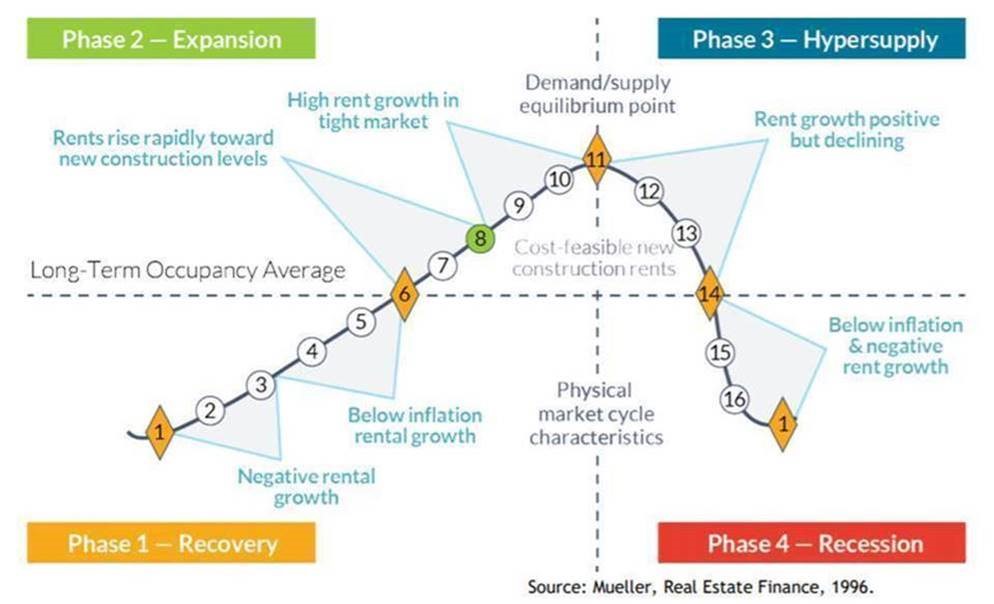
Across the cycle, Dr. Mueller describes rental behavior within each of the phases, using Market Levels ranging from 1 to 16. Equilibrium occurs at Market Level 11 in which demand growth equals supply growth – _literally the sweet spot_. The equilibrium Market Level 11 is also the peak occupancy level.
Phase 1 - Recovery _Declining Vacancy, No New Construction_
1-3 Negative Rental Growth
4-6 Below Inflation Rental Growth
Phase 2 - Expansion _Declining Vacancy, New Construction_
6-8 Rents Rise Rapidly Toward New Construction Levels
8-11 High Rent Growth in Tight Market
Phase 3 - Hypersupply _Increasing Vacancy, New Construction_
11-14 Rent Growth Positive But Declining
Phase 4 - Recession _Increasing Vacancy, More Completions_
14-16, then back to 1 Below Inflation, Negative Rent Growth
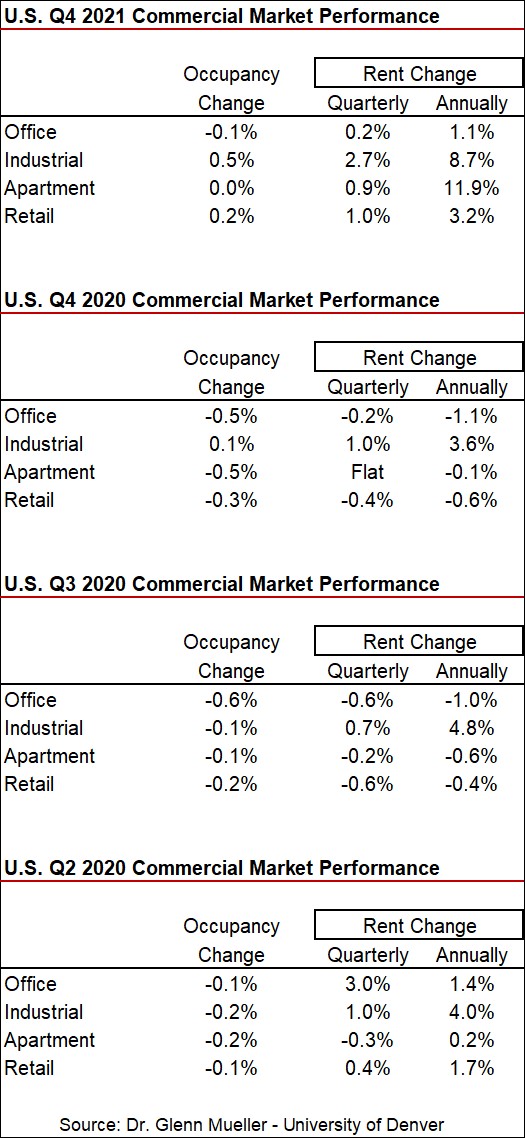
Rents and occupancy changes for Q4 2021 as reported by Mueller are detailed for the U.S. in aggregate in the following table. Ongoing big winners continue to be Apartments and Industrial properties. While Office and Retail properties show rent gains year-over-year as of Q4 2021, scan down the last three quarters of 2020 spanning from the start of the pandemic (Q2 2020) through Q4 2020. The gains in Q4 2021 are merely recapturing part of the losses suffered in the second-half of 2020 for these property types.
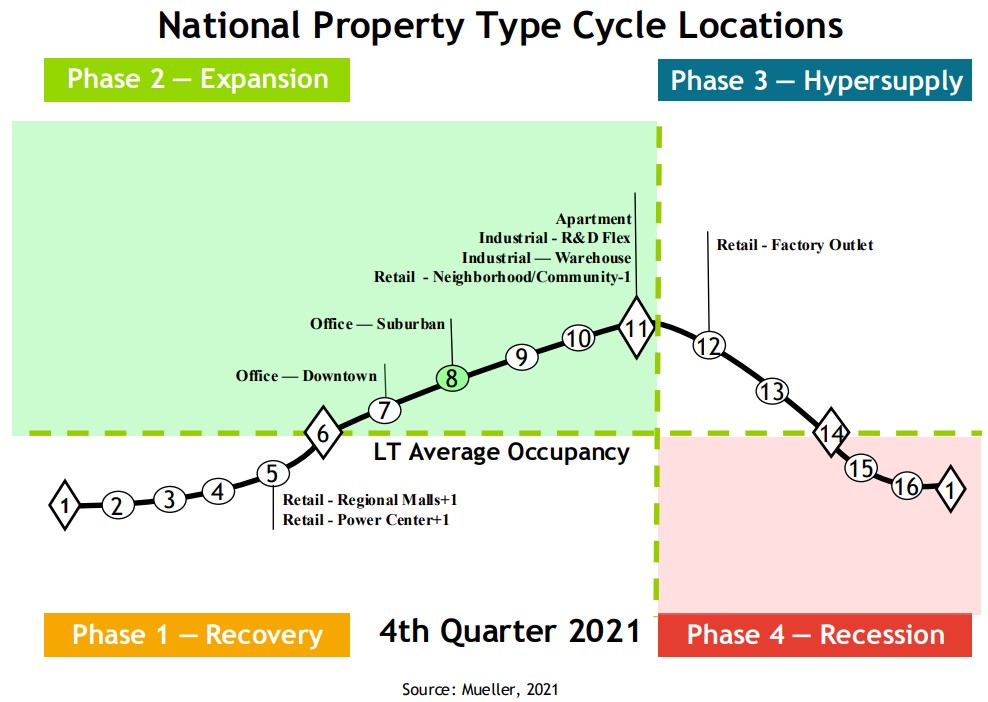
Dr. Mueller’s Q4 2021 report shows the current cycle stage from a national perspective across property types. Apartments, Industrial (Warehouse, Research & Development and Flex Space), and Retail (Neighborhood/Community – think grocery stores), with growing ecommerce and growing overall demand are in Phase 2 - Expansion _Equilibrium_ Market Level 11 with rents and occupancy levels at cycle peaks. While industrial properties are at a peak, JJL reported more than ½ billion square feet currently under construction.
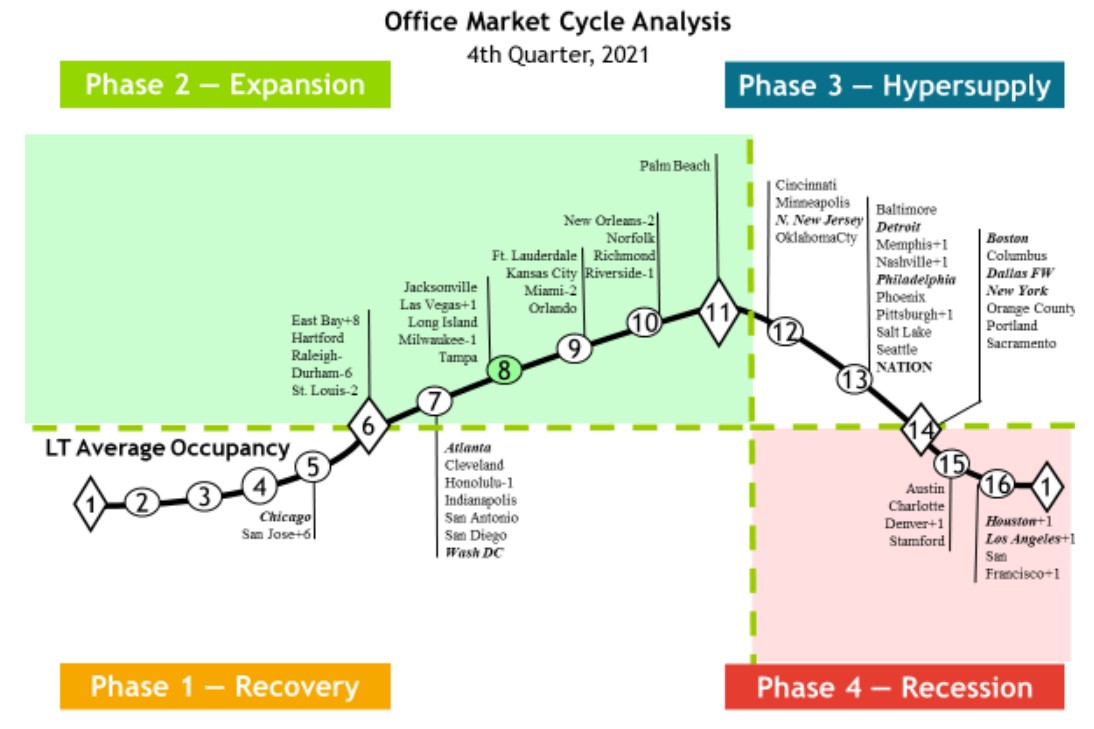
Downtown & Suburban Offices, though still in Phase 2 – Expansion are seeing rent growth but remain distant from top occupancy levels and rents. Other types of Retail (Regional Malls & Power Centers) remain outside of the desired Phase 2 – Expansion having either negative rental growth or rental growth at less than the rate of inflation. Retail (Factory Outlet) resides in Phase 3 – Hypersupply, which still has rent growth but at a declining rate.
Office is shown in the next table for 54 individual Metros across the country. [Download the report for all other property types.] Twenty of the Metros in Mueller’s study (37 percent) were in Phase 3 – Hypersupply as of Q4 2021. Seven of the metros (13 percent) of the office markets were in Phase 4 – Recession), with rent growth below inflation or negative. Markets that are shown in _bold italic_ font (11 of the 54 office markets) make up 50 percent of the total space monitored by Mueller’s report.
Across Industrial properties, all but one of the metros are the ideal Market Level 11 – the outlier being Stamford Connecticut.

Mueller’s quarterly report is based on almost 300 individual econometric models. Unfortunately data for hotels are no longer available.
Pay attention to each of the property types in the report focusing on cities that have excess supply, and also those with supply trailing demand.
To download current and historical quarterly reports click daniels.du.edu/burns-school and scroll down to the REAL ESTATE MARKET CYCLE REPORT section on the Website. For the Q4 2021 report click Microsoft Word - Cycle Monitor 21Q4-2.docx (du.edu)
To learn more about Dr Glenn Mueller click daniels.du.edu/directory/glenn-mueller
For commercial real estate practitioners, Dr Mueller’s is essential reading quarterly.