
Commercial Real Estate Cycles Across the U.S. & 54 Metros, 5 Property Types - Q2 2022 Dr Glenn Mueller

Inflation, alternative investment yields, the economy and the ongoing recovery from the pandemic continue to bolster demand for commercial real estate in Q2 2022 across all property types. Detailed market-specific insight is critical to ascertain where individual real estate markets are currently at and where they are heading.
Dr Glenn Mueller’s quarterly Commercial Real Estate Cycles report gives just that perspective on what is going on in commercial real estate across the country with specifics for 54 metros for Apartments, Industrial, Office, and Retail. In addition data returning this quarter now again include Hotel properties. Dr. Mueller defines four distinct phases in the commercial real estate cycle providing decision points for investment and exit strategies. Long-term occupancy average is the key determinant of rental growth rates and ultimately property values. Ideally, Phase 2 - Expansion is the ideal quadrant for real estate investor performance as shown in the following two graphs and discussion. All graphs in this summary are taken directly from Dr Mueller’s Q2 2022 report.
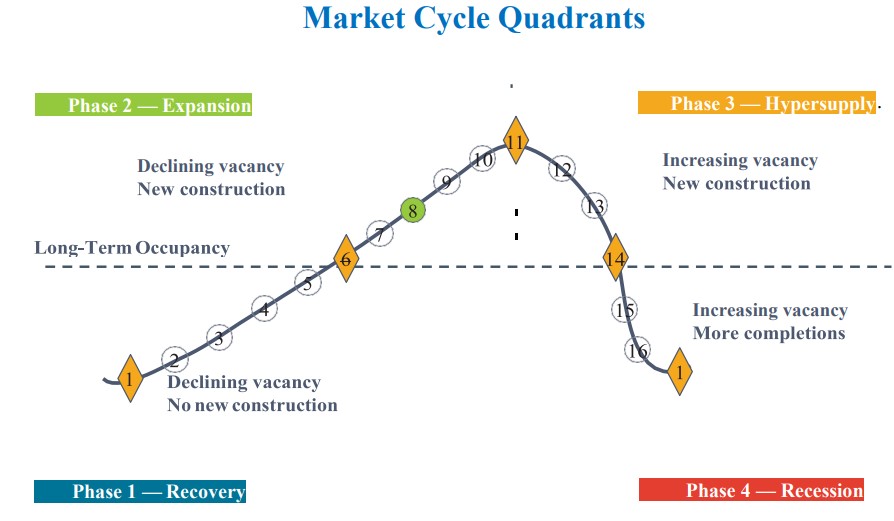
Across the cycle, Dr. Mueller describes rental behavior within each of the phases, using Market Levels ranging from 1 to 16. Equilibrium occurs at Market Level 11 in which demand growth equals supply growth – _literally the sweet spot_. The equilibrium Market Level 11 is also the peak occupancy level.
Phase 1 - Recovery Declining Vacancy, No New Construction
1-3 Negative Rental Growth
4-6 Below Inflation Rental Growth
Phase 2 - Expansion Declining Vacancy, New Construction
6-8 Rents Rise Rapidly Toward New Construction Levels
8-11 High Rent Growth in Tight Market
Phase 3 - Hypersupply Increasing Vacancy, New Construction
11-14 Rent Growth Positive But Declining
Phase 4 - Recession Increasing Vacancy, More Completions
14-16, then back to 1 Below Inflation, Negative Rent Growth
Rent growth across the cycle is characterized as follows:

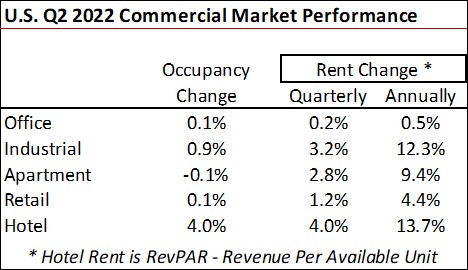
Rents and occupancy changes for Q2 2022, as reported by Mueller, are detailed for the U.S. in aggregate in the following table. Ongoing big winners continue to be Apartments and Industrial properties with annual rent gains of 12.3 percent and 9.4 percent, respectfully. Hotels, while up the most suffered the greatest at the onset of the pandemic. Retail properties show minimal rent gains of 4.4 percent annually, while Offices were essentially flat. Gains in Retail are no surprise given the material improvement in consumer purchases. Advanced retail sales were up an average 9.1 percent monthly in the first-half of 2022 compared to the same period in 2021 based on data from Federal Reserve Economic Data (FRED) at the St Louis Fed.
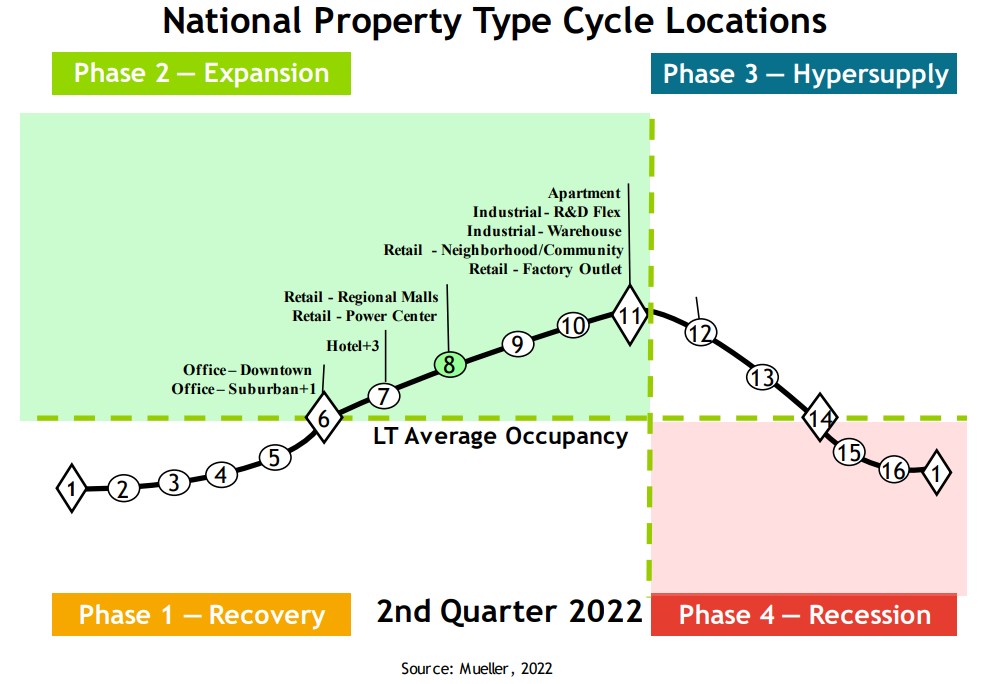
Dr. Mueller’s Q2 2022 report shows the current cycle stage from a national perspective across property types. All property types were in Phase 2 – Expansion in Q2 for the U.S., which I believe is a first-time occurrence indicating favorable commercial real estate markets in general. Property types at the peak performance Market Level 11 included: Apartment, Industrial R&D – Flex, Industrial – Warehouse, Retail – Neighborhood/Community (think grocery stores), and Retail – Factory Outlet.
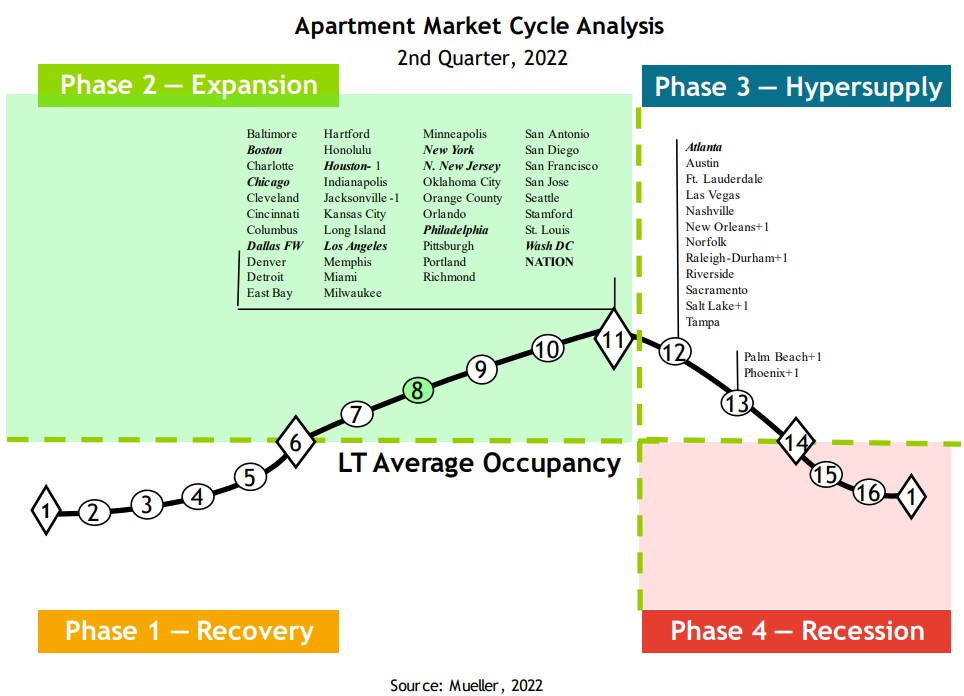
The same is not true when it comes to individual markets across the country. Apartment is shown in the next table for 54 individual Metros across the country. [Download the report for all other property types – link is below.] Fourteen of the Metros in Mueller’s Q2 2022 study (26 percent) were in Phase 3 – Hypersupply as of Q2 2022. All of the remaining metros were in Phase 2 – Expansion, but just eight were at the Equilibrium Market Level 11. Markets that are shown in _bold italic_ font make up 50 percent of the total space monitored by Mueller’s report. The numbers with + or – following the metro name show the change of that metro’s Market Level from the prior quarter.
Mueller’s quarterly report for the 54 covered metros and the U.S. is based on almost 300 individual econometric models.
Pay attention to each of the property types in the report focusing on cities that have excess supply, and also those with supply trailing demand.
To download current and historical quarterly reports click daniels.du.edu/burns-school and scroll down to the REAL ESTATE MARKET CYCLE REPORT section on the Website.
For the Q2 2022 report click Legg Mason Wood Walker Real Estate Market Cycle Monitor (du.edu)
To learn more about Dr Glenn Mueller click daniels.du.edu/directory/glenn-mueller
For commercial real estate practitioners, Dr Mueller’s is essential reading quarterly. Again, thanks to Glenn for exceptional cutting edge commercial research.