
Half Way There - 25 States Back to Pre-Pandemic Employment Levels, 25 to Go But Headwinds Picking Up

At the onset of the pandemic in March 2020, the U.S. lost 22 million jobs when comparing pre-pandemic employment counts (February 2020) to April 2020. In comparison, the U.S. lost 8.7 million jobs in the 25 months from January 2008 to the Great Recession trough in February 2010 according to the U.S. Bureau of Labor Statistics (BLS) using seasonally adjusted data.
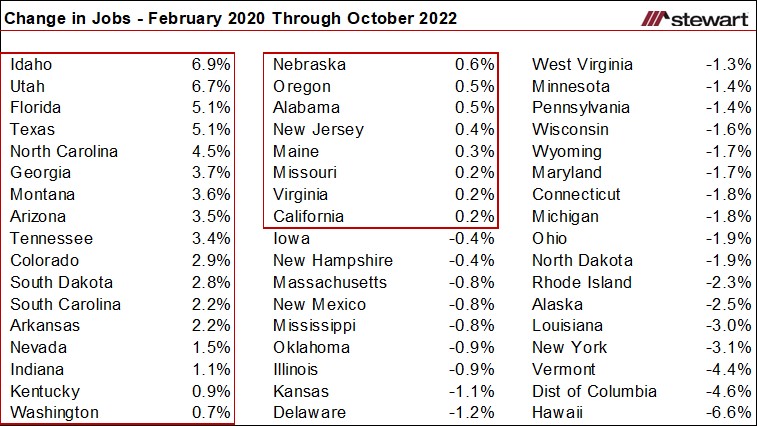
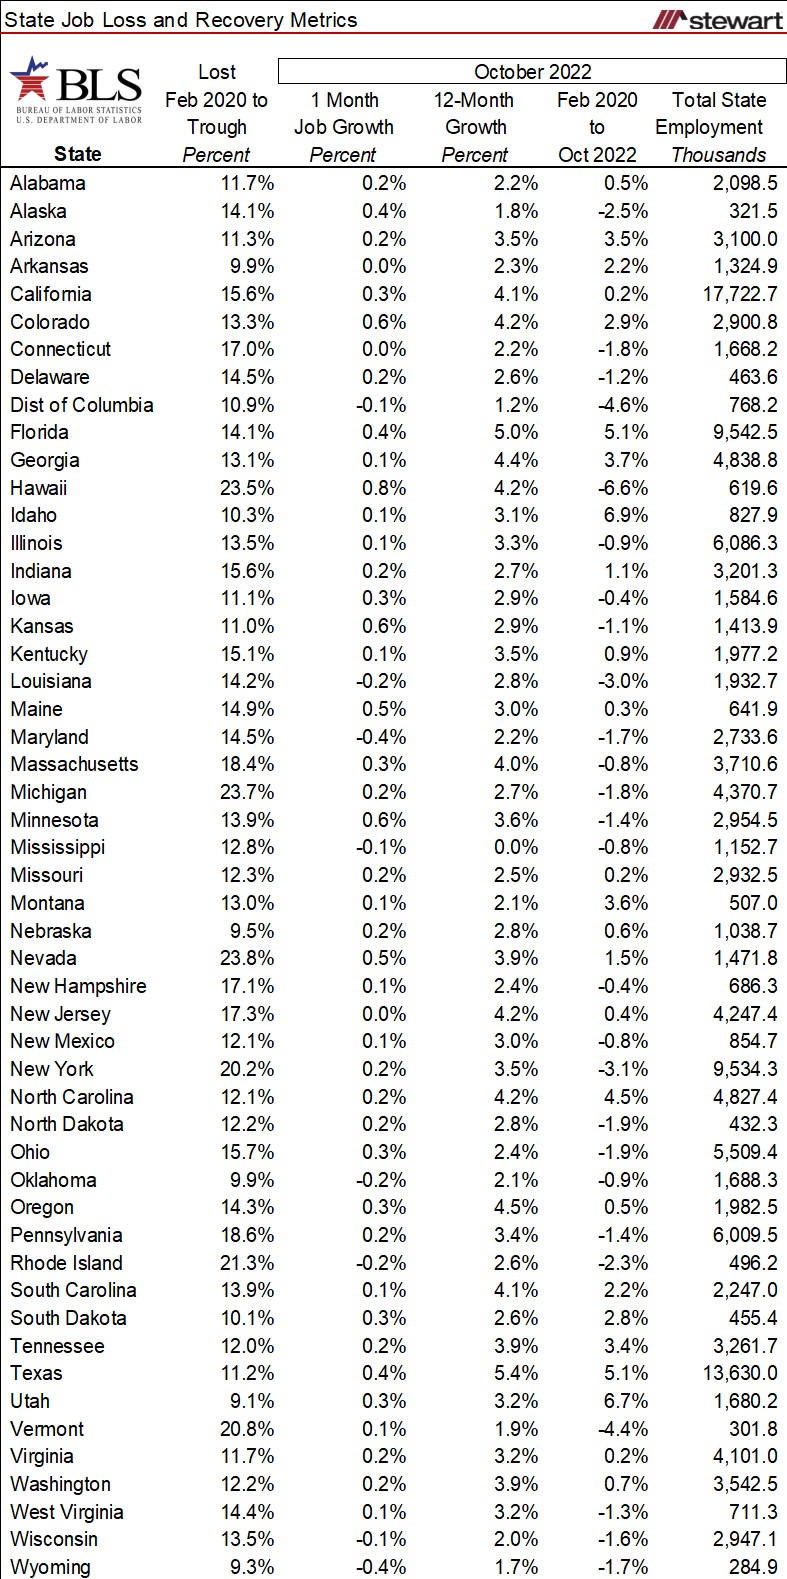
As of October 2022, the BLS data show 25 states had more jobs than any time in history. The first table shows the percentage change in jobs from February 2020 (the month prior to the pandemic) compared to October 2022 sorted by relative recoveries. Also included is the District of Columbia. Idaho and Utah continue to lead job growth since February 2020, with gains of 6.9 percent and 6.7 percent, respectively. Least recovered since the pandemic include Hawaii down 6.6 percent, the District of Columbia -4.6 percent and Vermont -4.4 percent.
Not all states were equally slammed employment-wise by the pandemic as shown in the next table. From February to April or May in 2020, Michigan lost almost one-in-every-four jobs (-23.7 percent) while Utah shed the fewest at just one-in-every 12 (-8.9 percent).

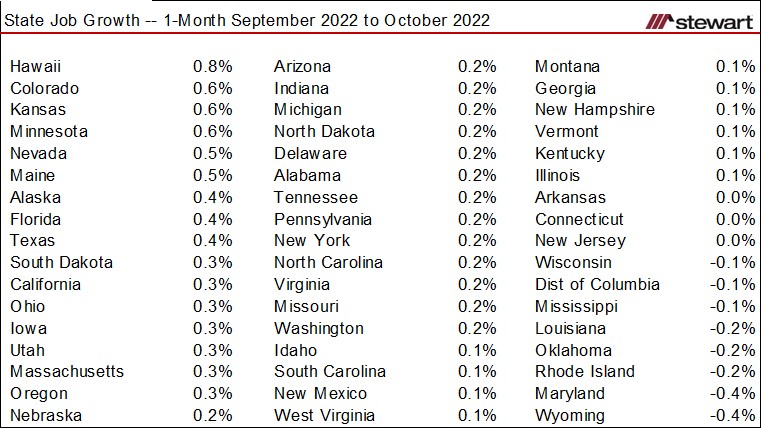
Though Hawaii trails the U.S. overall in job recovery post-pandemic, the Aloha state surged back last month as travel continues to recover, posting the best one-month job growth rate from September to October 2022 of 0.8 percent. Largest one-month job loss rate of -0.4 percent included Wyoming and Maryland. One-month job gains or losses are shown for all states and D.C. in the next table.
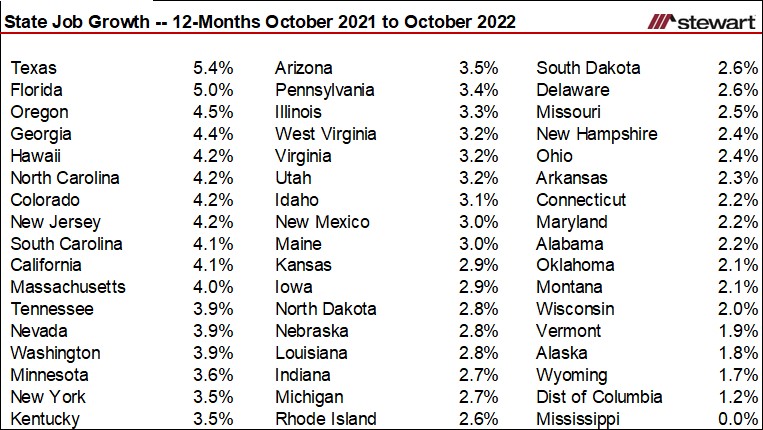
Job change rates for the 12-months ending October 2022 are detailed in the following table. Best 12-month performance include Texas (+5.4 percent) and Florida (+5.0 percent). None posted a job loss for the 12-month period, but Mississippi showed a zero-percentage change over the period.
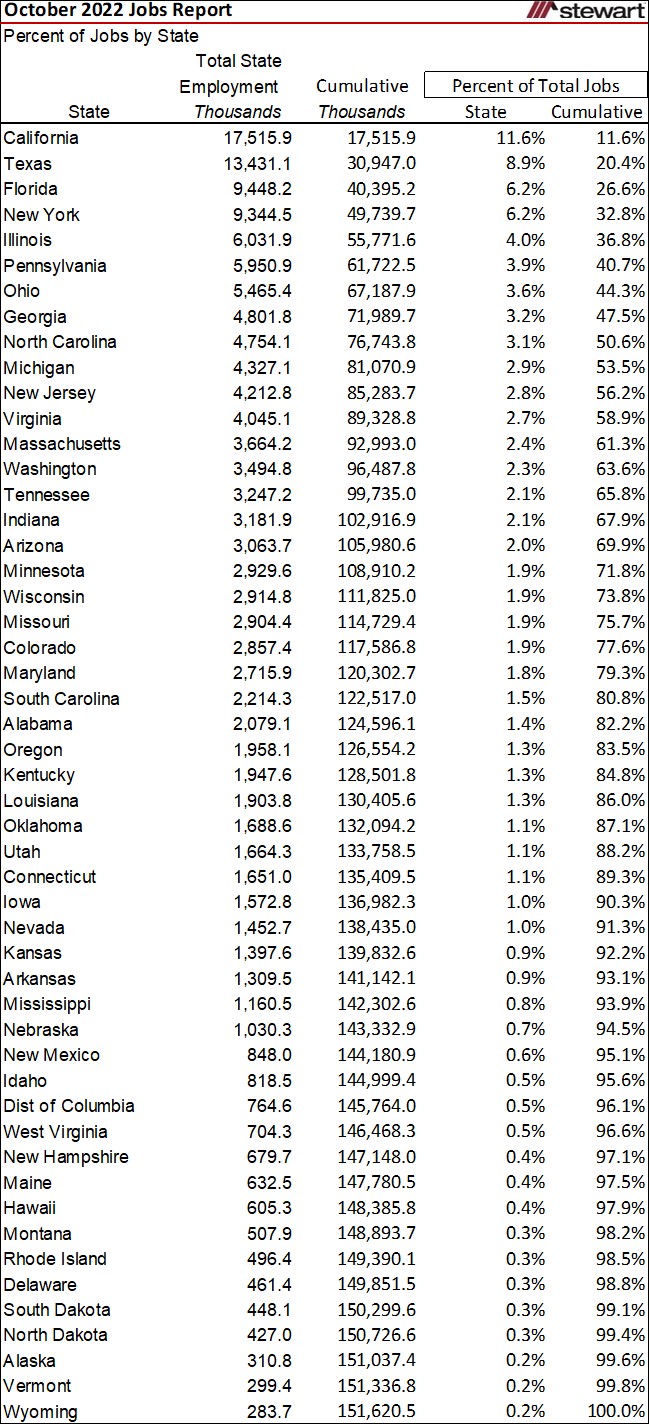
Total employment as of October 2022 is shown in the next table sorted by state from the most to the fewest number of jobs. Also included is the cumulative percentage of jobs by state. Nine states account for one-half (50.6 percent) of all U.S. jobs.
Employment metrics for all 50-states and the District of Columbia are detailed in the last table.
The BLS provides a plethora of job- and workforce-related data monthly ranging from county to national levels. This data can be accessed at www.bls.gov, then click the DATA TOOLS tab.
Not all of the roughly $5 trillion of federal pandemic stimulus has yet been spent, but it still is having an impact on positive job growth. With 10s of thousands of tech and ecommerce job cuts announced recently and just coming off the highest inflation in 40 years concerns are the U.S. is headed to a recession with the following expectations:
Fannie Mae – modest recession will commence in Q1 2023
The Conference Board – economic weakness to see a recession to begin around the end of 2022
Bloomberg – probability of a recession is now 100 percent within a year
JPMorgan – mild recession in 2023
Forbes – recession will begin late 2022 or early 2023
Former Boston Fed President Eric Rosengren – U.S. likely headed to mild recession in 2023
FitchRatings – recession to start in Q2 2023
University of Michigan Economists – mild recession ahead in 2023
If they are correct regarding a recession, job losses may return in 2023 delaying recovery further for the 25 states yet to get back to pre-pandemic job numbers. Pay close attention to job numbers to gauge where the economies -- from county to federal levels -- are heading.
Jobs are everything to the economy. Period. It’s all about jobs.
Ted