
MSA Job Growth: 10-Year, 5-Year and 1-Year Performance; Plus, Other Metrics for June 2022 Data

It’s all about jobs when it comes to analyzing the economy and ultimate demand for real estate. Each month the U.S. Bureau of Labor Statistics (BLS) releases job numbers and related metrics for 380 Metropolitan Statistical Areas (MSAs). Seasonally adjusted data are summarized in the following analyses facilitating an apples-to-apples comparison of any month to another.
Prior to the pandemic this blog typically compared the best 1-month and 12-month job growth rates. At the onset of the pandemic the focus was on total job losses and relative percentage of total employment in the Leisure & Hospitality sector – the hardest hit segment by COVID 19. Since then monthly reports have examined which MSAs had recovered to pre-pandemic job numbers and which lagged the most. In contrast, this June 2022 report looks at the longer-term job gains since one-third of all MSAs now have more jobs than any time in history (35.0 percent). Ideally, the economic goal is for long-term sustainable job growth rates over time rather than a one-hit-wonder or flash-in-the pan surge followed by volatility.
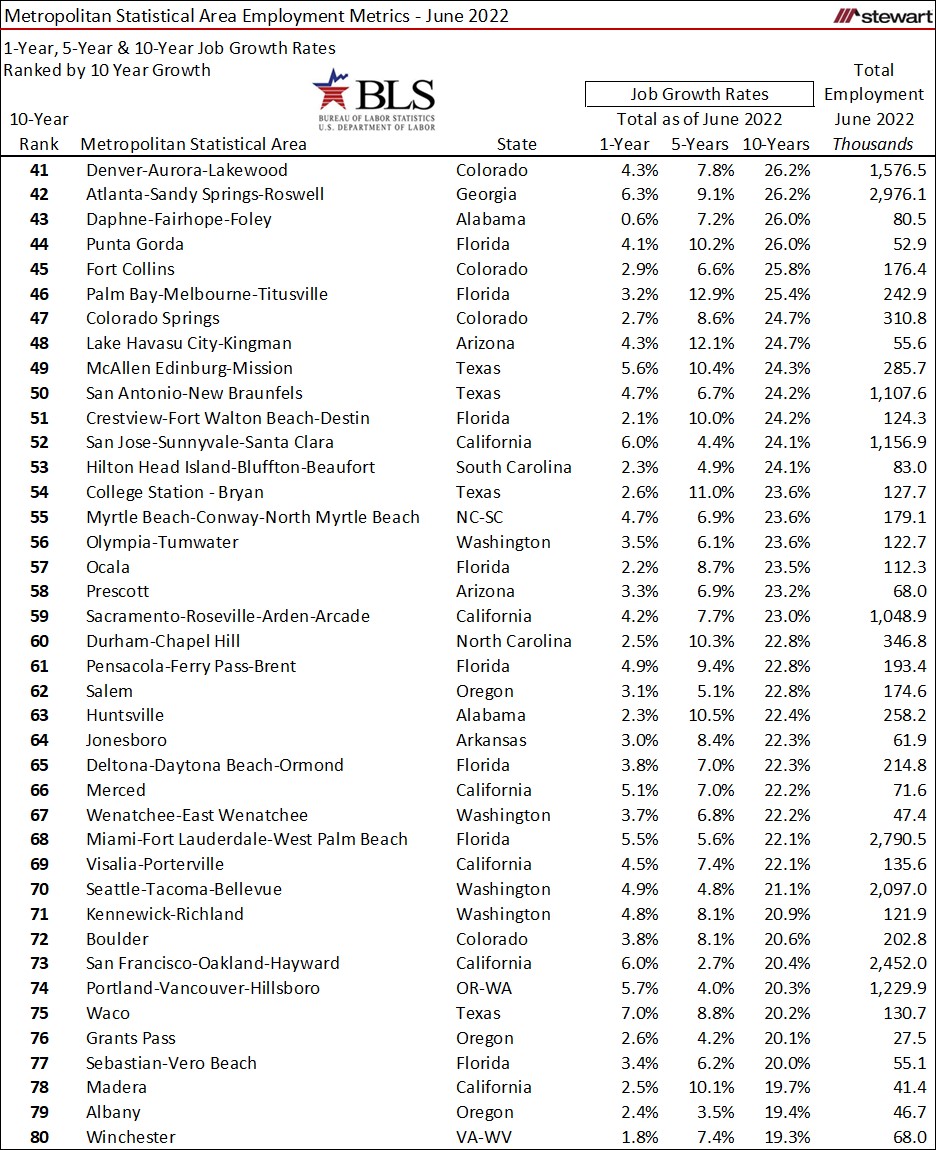
The first two tables show the 80 MSAs with the best percentage gain in jobs in the 10-years commencing June 2012 to June 2022. Also included are job growth rates for 1-year and 5-year intervals and total employment numbers as of June 2022.
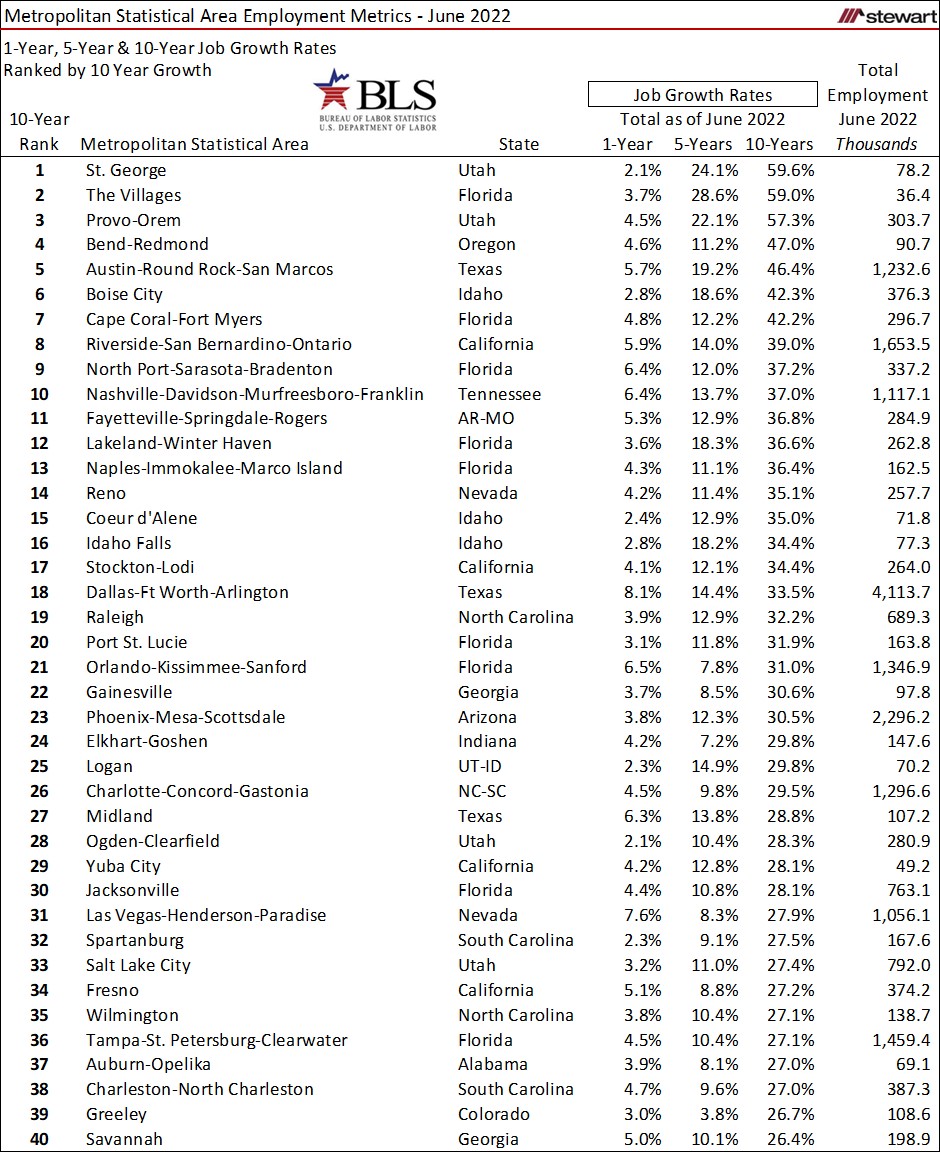
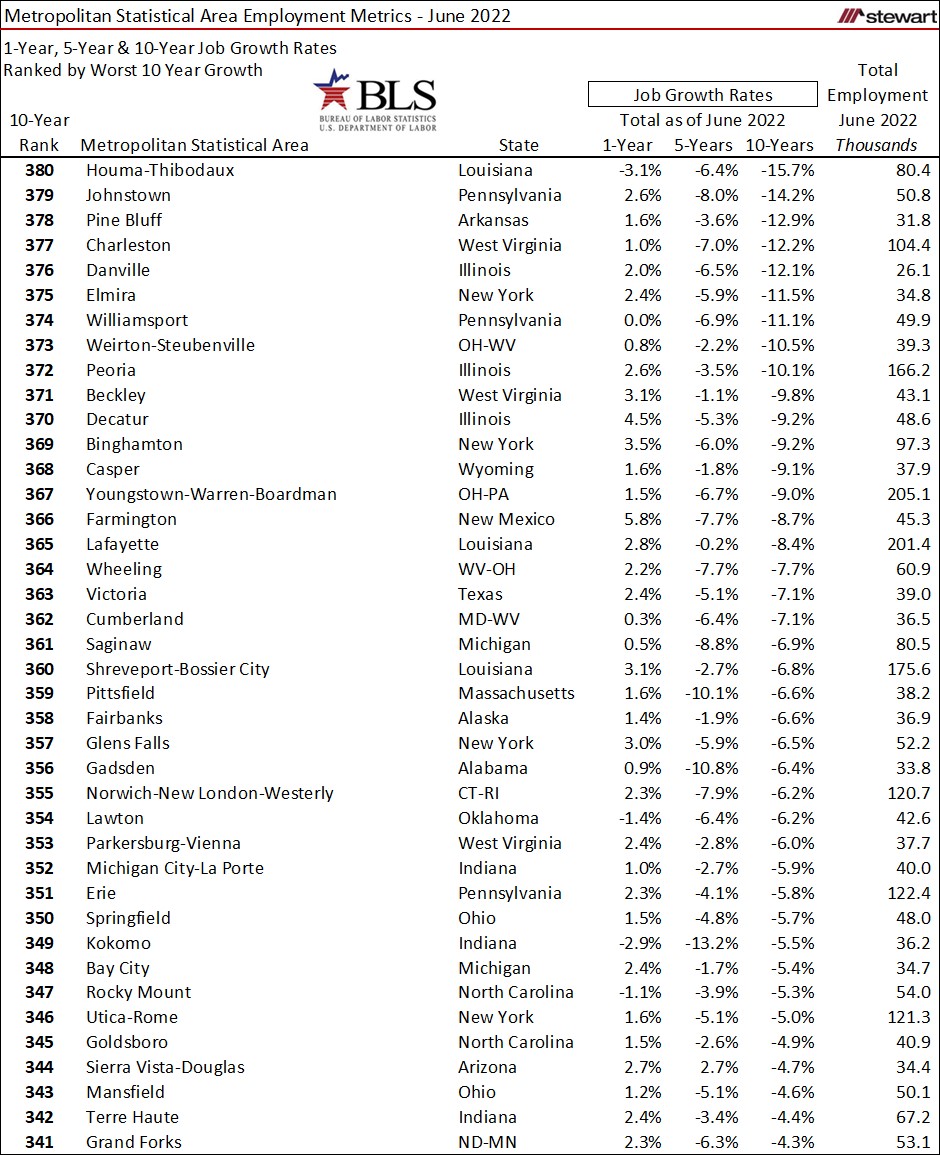
The next table shows the 40 worst MSAs regarding job numbers for the past 10-years. Topping the list in lack of performance was Houma-Thibodaux, Louisiana which lost one-out-of-every-6-jobs (15.7 percent) from June 2012 to June 2022. It was down 3.1 percent in the past 12-months. In comparison, St George, Utah added six-additional jobs for every 10-jobs present as of June 2012 – the best gain in the U.S. Click here for pdf showing 1-year, 5-year and 10-year job growth rates for all 380 MSAs sorted by 10-year job performance.
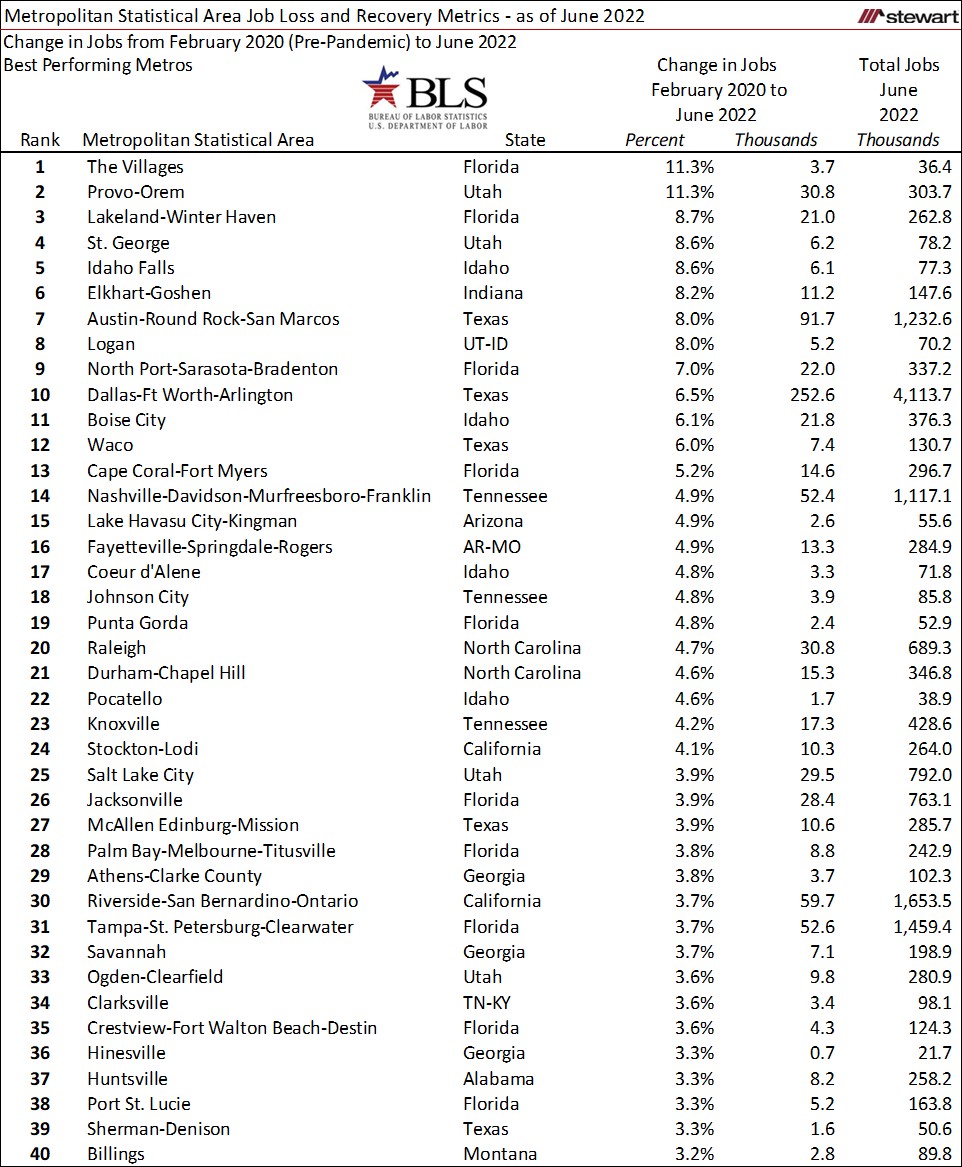
Job losses nationwide at the onset of the pandemic tallied almost 23 million in March and April 2020 – the greatest hemorrhage of job numbers in U.S. history. Job losses were not equal, however, ranging from a low of 5.7 percent in the Logan, Utah-Idaho MSA to a massive 36.7 percent drop in Atlantic City-Hammonton, New Jersey MSA. The same is true with the recovery. The first two tables show the percentage change in jobs for the 80 top-performing MSAs from February 2020 (the month prior to the pandemic) to June 2022. Within the 380 MSAs, 130 reported a gain in jobs from February 2020 to June 2022, three were flat (0.0 percent change) and 247 still lagging pre-pandemic employment levels. Two MSAs, The Villages, Florida and Provo-Orem, Utah, grew by double-digits with each having 11.3 percent more jobs as of June 2022 compared to February 2020.
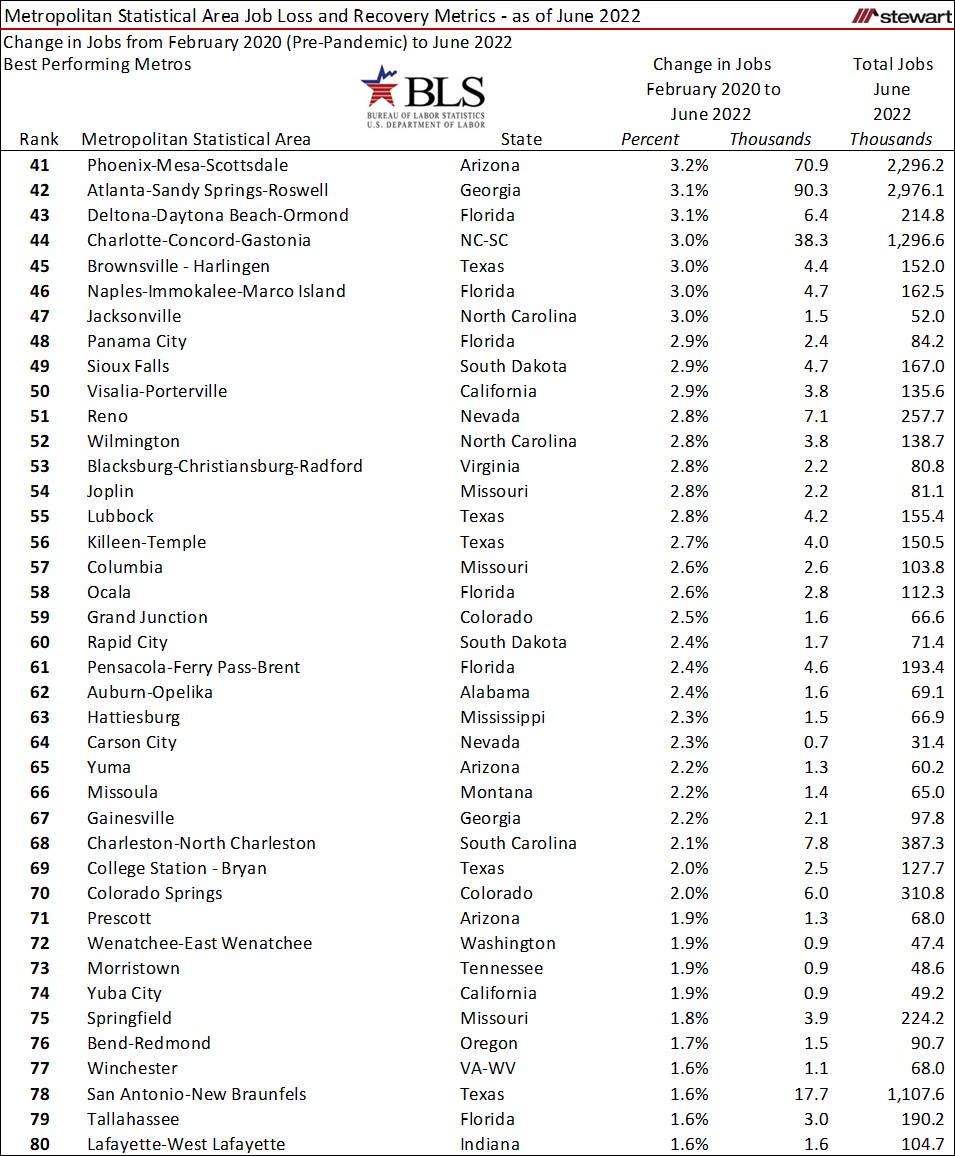
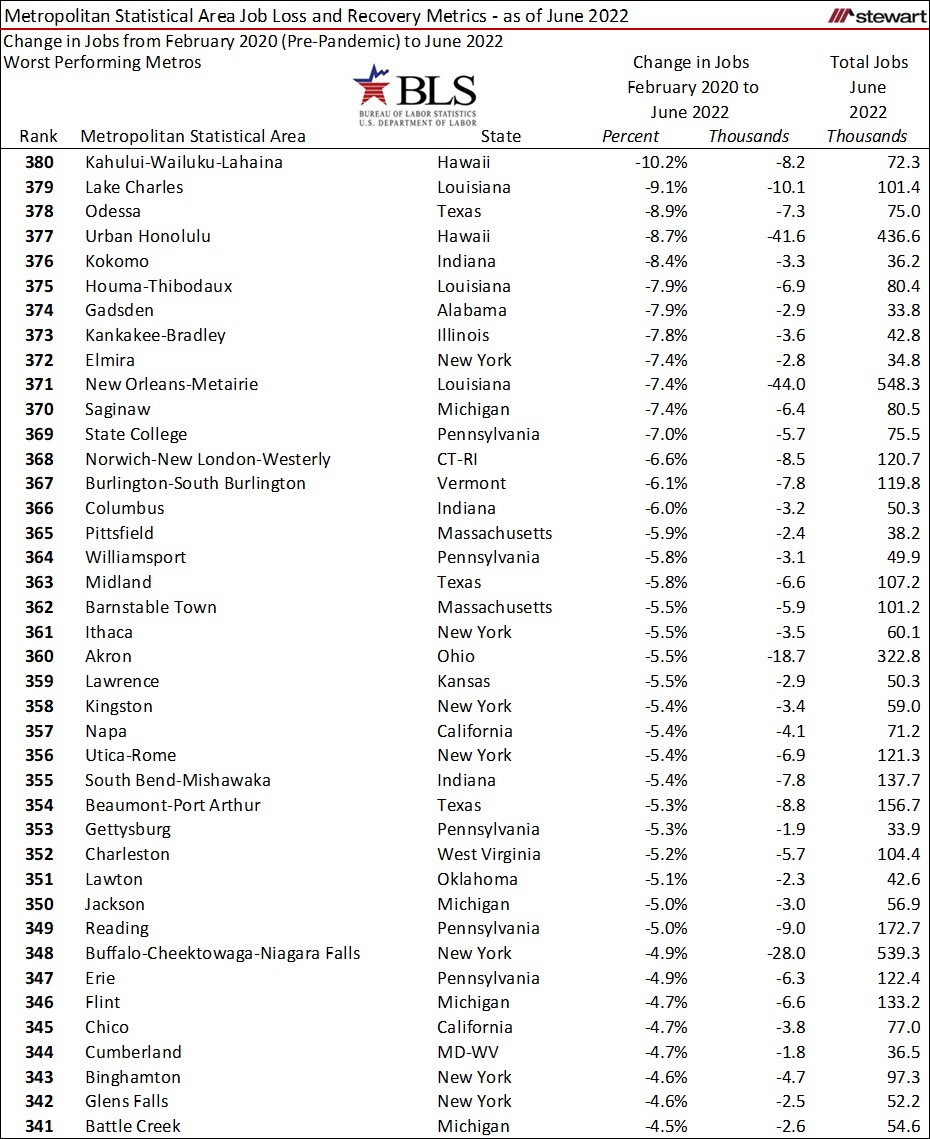
The 40 least-recovered MSAs from February 2020 (pre-pandemic) to June 2022 are detailed in the next table.
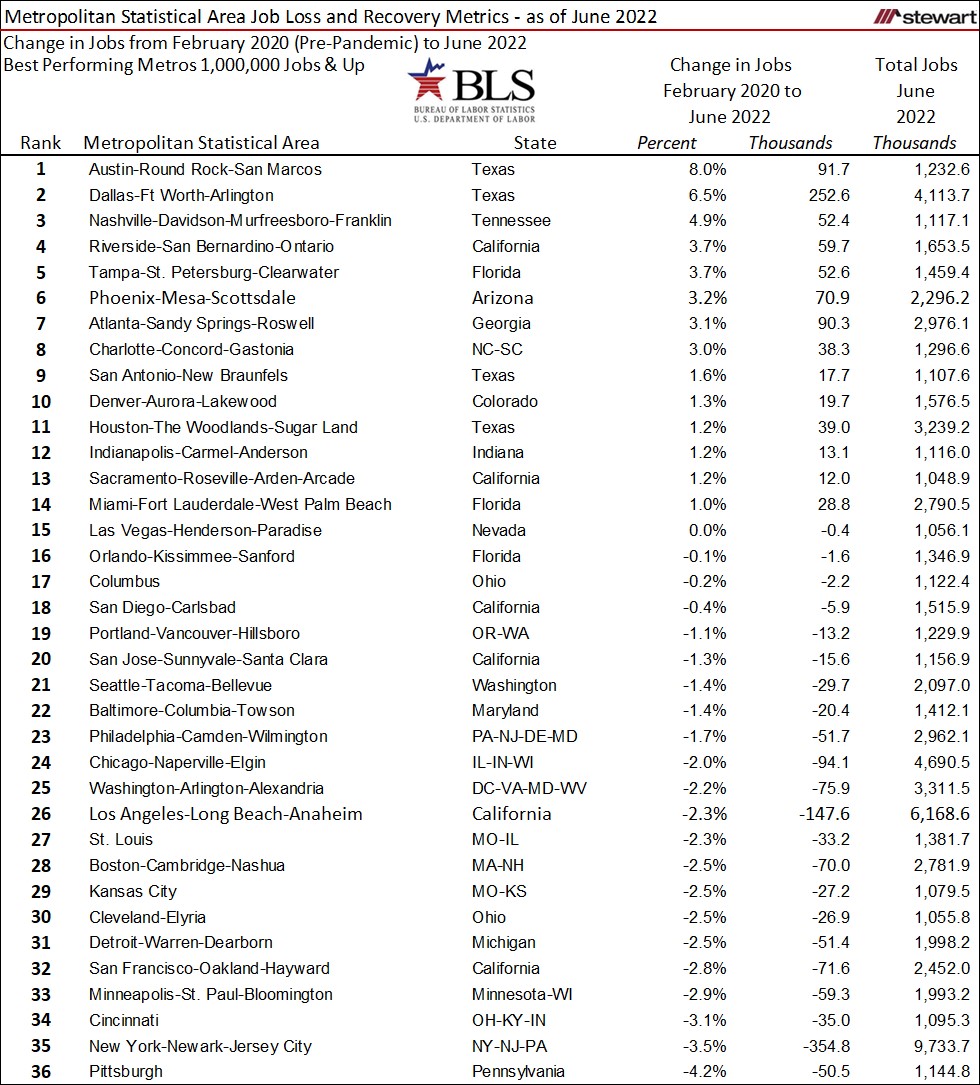
The last table shows the performance of the largest cities in the country - those having at least 1 million jobs as of June 2022. Though only 36 MSAs have 1 million or more jobs, the 36 make up six-out-of-every-10 jobs in the U.S. Within the 36 1-million+ job MSAs, only 15 had recouped all job numbers present prior to the pandemic.
The following PDF file shows other employment summary metrics for all 380 MSAs, sorted alphabetically by state and MSA.
Good news is that finally, instead of analyzing the employment losses resulting from the pandemic each month, longer-term gains and overall market performance for many metros are now the topics of discussion. Jobs are everything, and for many MSAs now a positive talking point in where the economy and real estate markets are heading.