MSA Job Growth October 2022

10, 5 and 1 Year Performance Plus Other Metrics
Jobs are everything when it comes to analyzing the economy and the ultimate demand for real estate. The U.S. Bureau of Labor Statistics (BLS) releases job numbers and related metrics monthly for 380 Metropolitan Statistical Areas (MSAs). Seasonally adjusted data are summarized in the following analyses facilitating an apples-to-apples comparison of any month to another. The onset of the pandemic in March 2020 saw the U.S. lose 22 million jobs when comparing pre-pandemic employment counts (February 2020) to April 2020 across the country. The incidence of loss and recovery rates since then vary widely on an MSA basis, however. The TINSTAANREM axiom is applicable — There Is No Such Thing As A National Real Estate Market or economy. The same is true with respect to job losses and respective recovery across metros today.
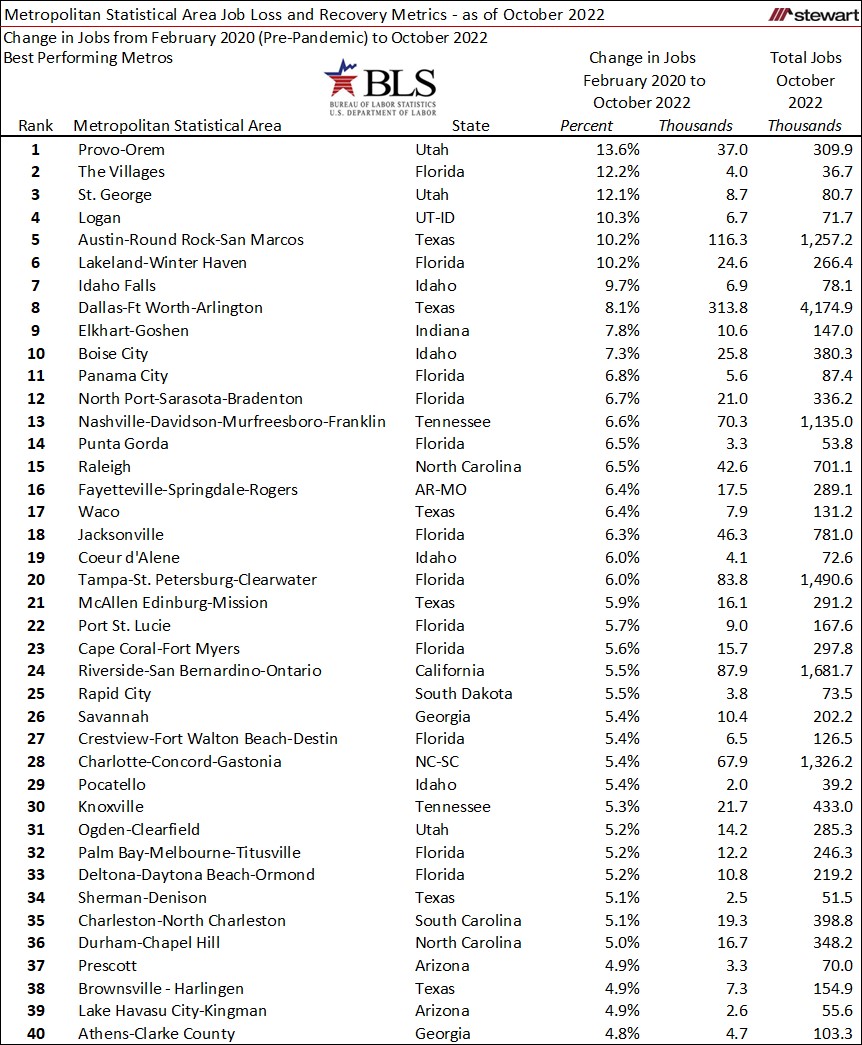
The first table shows the 40 MSAs with the best job performance rates from February 2020 (the month prior to the pandemic) to October 2022. Within the 380 MSAs, 162 (42.6 percent) now have more jobs than ever before in history, four have the same number of jobs (1.0 percent), and 214 still lag in job numbers (56.3 percent). Six MSAs now have at least 10 percent more jobs than prior to the pandemic:
- +13.6% Provo-Orem, Utah
- +12.2% The Villages, Florida
- +12.1% St George, Utah
- +10.3% Logan, Utah-Idaho
- +10.2% Austin-Round Rock-San Marcos, Texas
- +10.2% Lakewood-Winter Haven, Florida
-
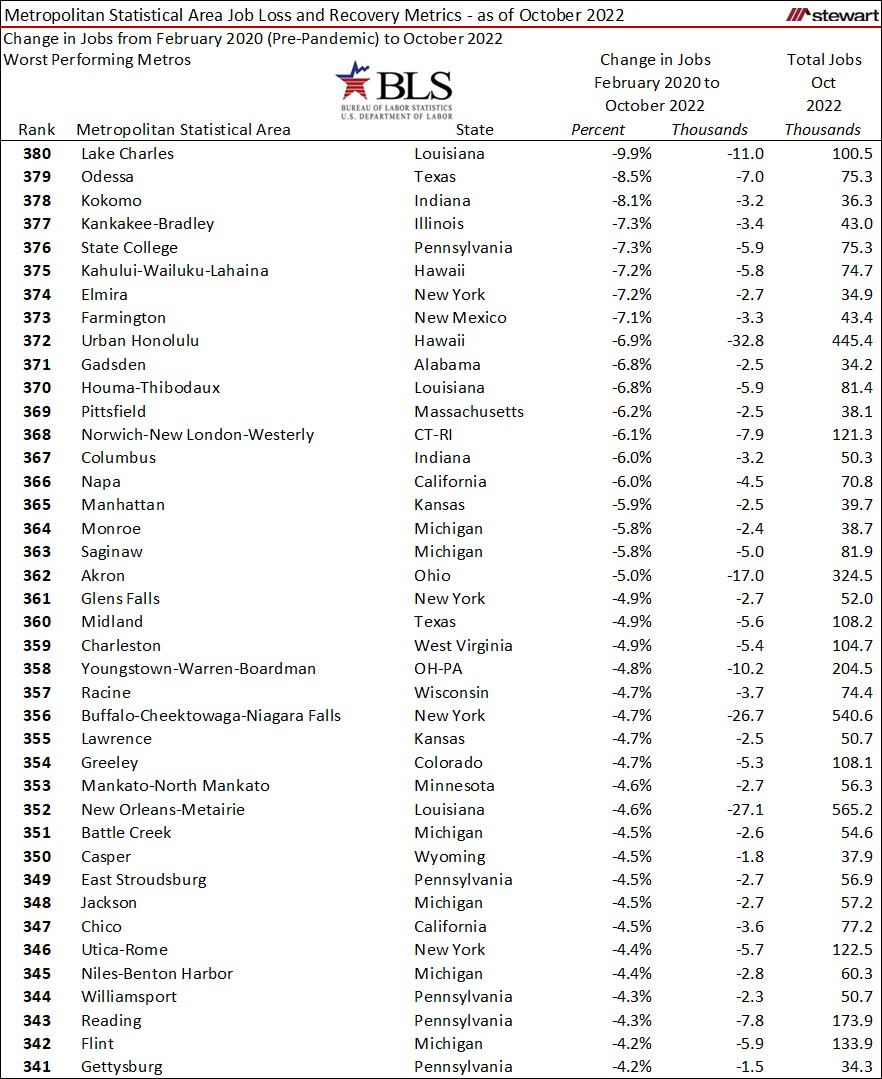
- The 40 worst performing MSAs from February 2020 (the month prior to the pandemic) to October 2022 are detailed in the next table.
-
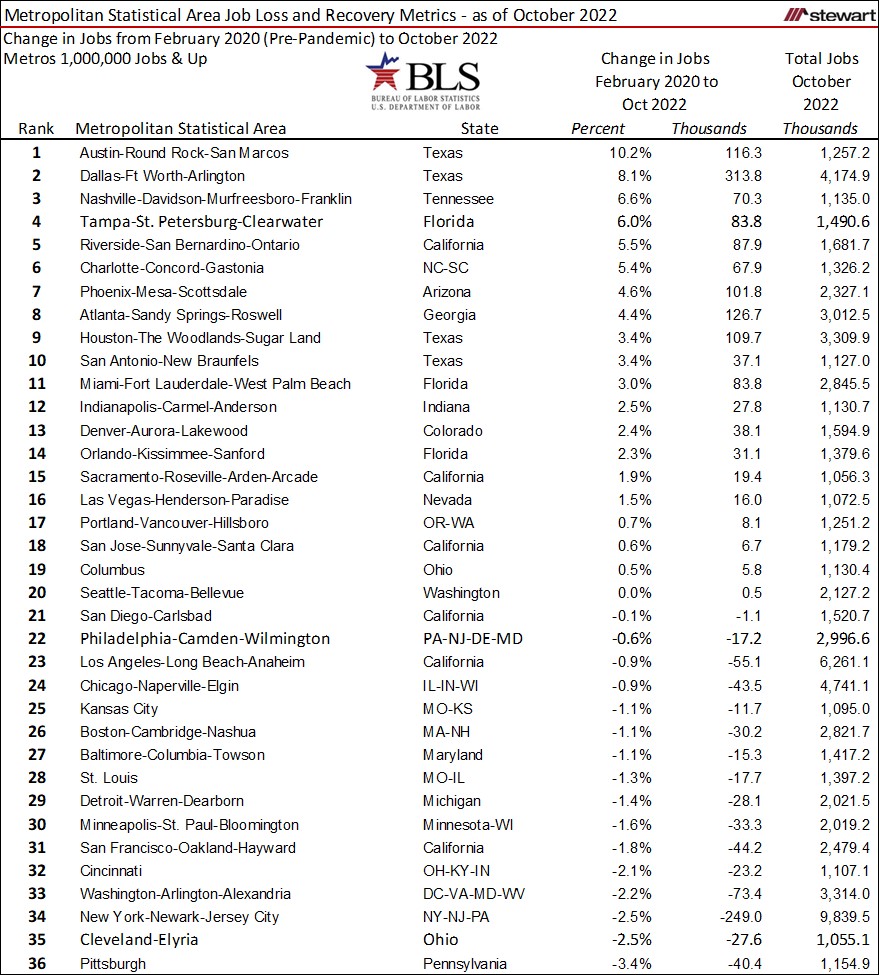
- Rankings of the 36 MSAs with 1 million or more jobs are detailed in the next table for the time period from February 2020 to October 2022. Within the MSAs with at least 1 million jobs, slightly more one-half (52.8 percent) now have more jobs than ever before.
-
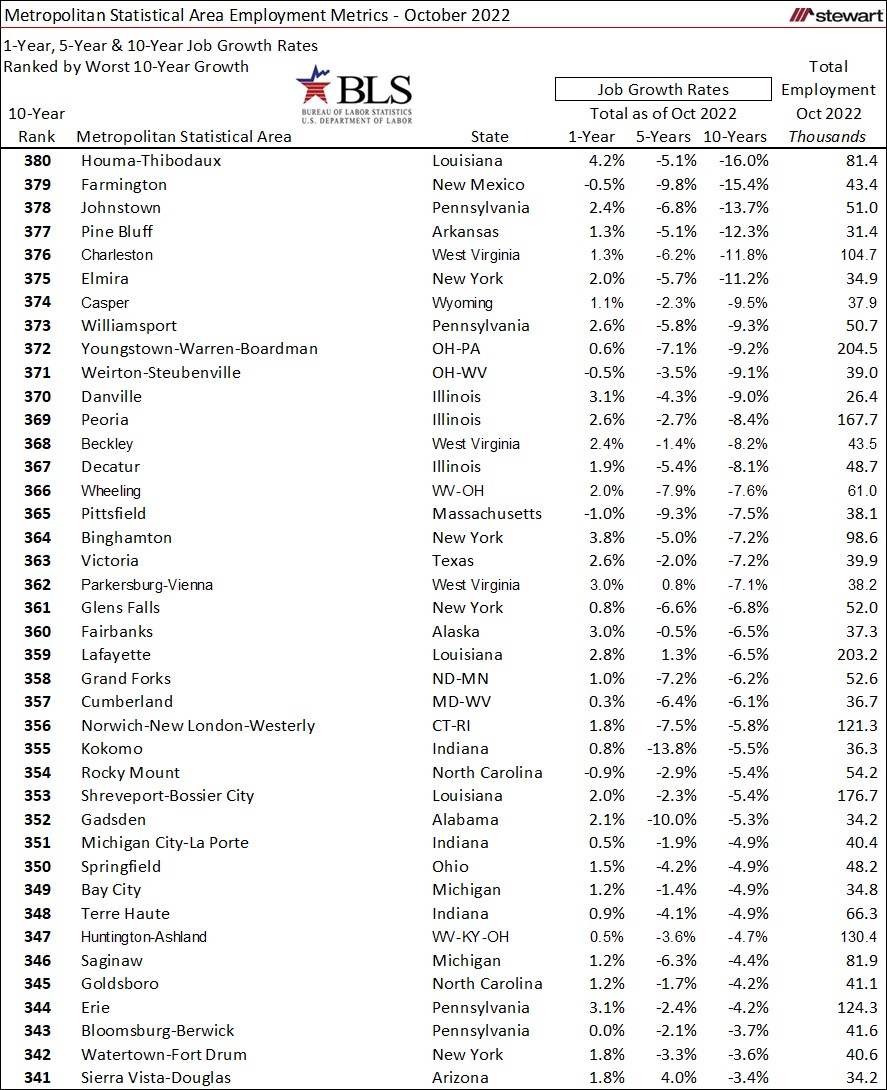
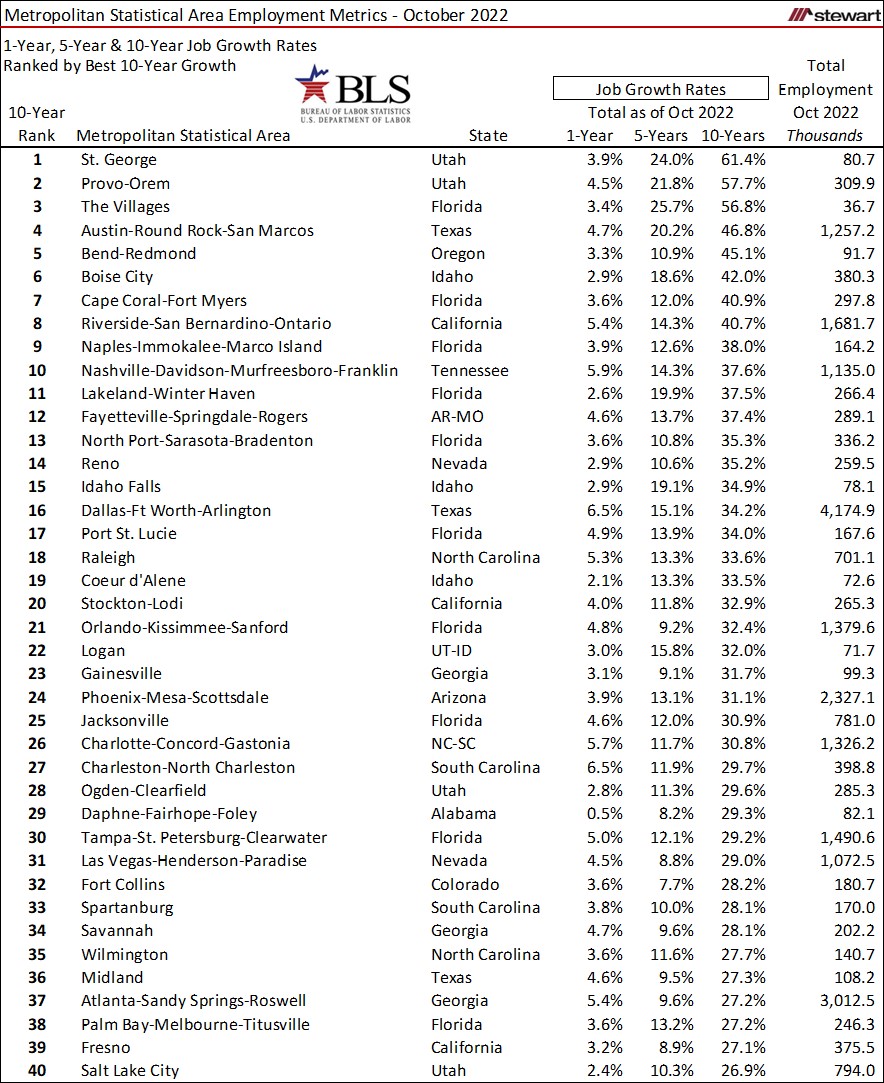
- The next two tables show the 40 MSAs each with the worst and best percentage gain in jobs in the 10-years from October 2012 to October 2022. Also included are job growth rates for 1-year and 5-year intervals and total employment numbers as of October 2022. Topping the list in lack of performance was Houma-Thibodaux, Louisiana which lost one-out-of-every-6-jobs (16.0 percent) in the 10-years ending October 2022. It was down 4.2 percent in the past 12-months. In comparison, in the past 10-years St George, Utah added six-additional jobs for every 10-jobs present as of October 2022 – the best gain in the U.S.
-
-
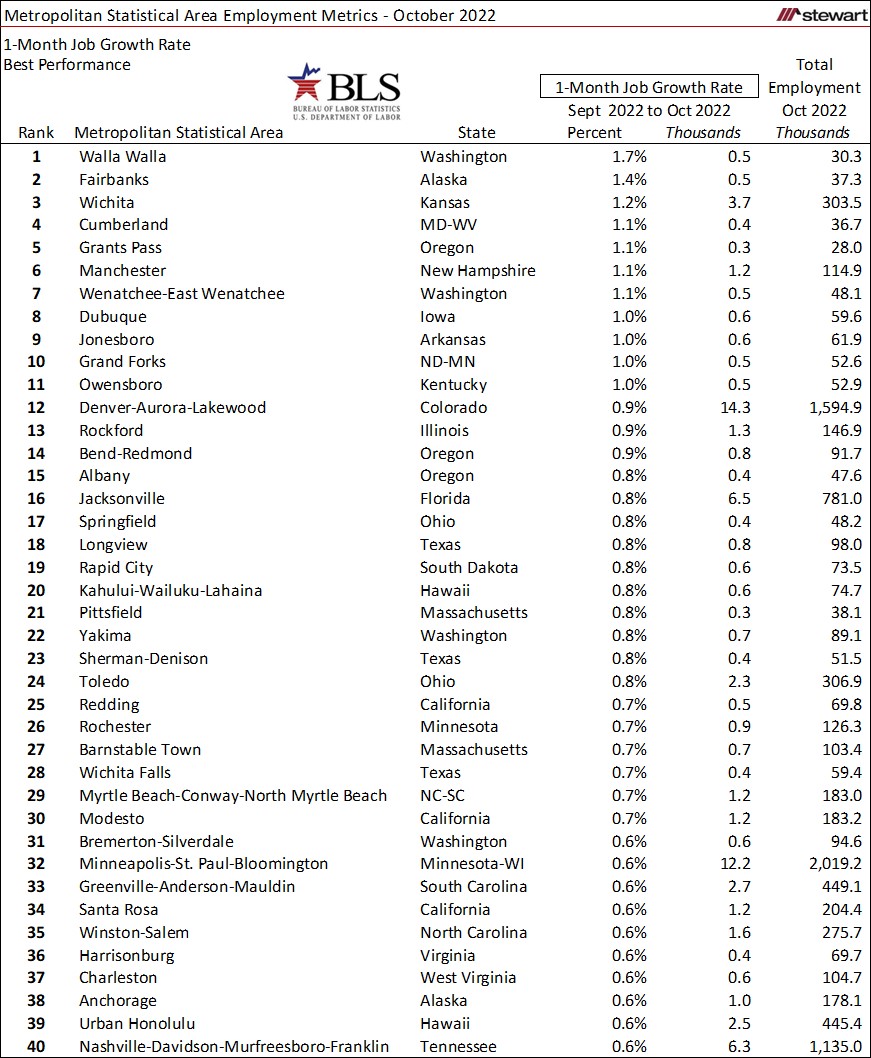
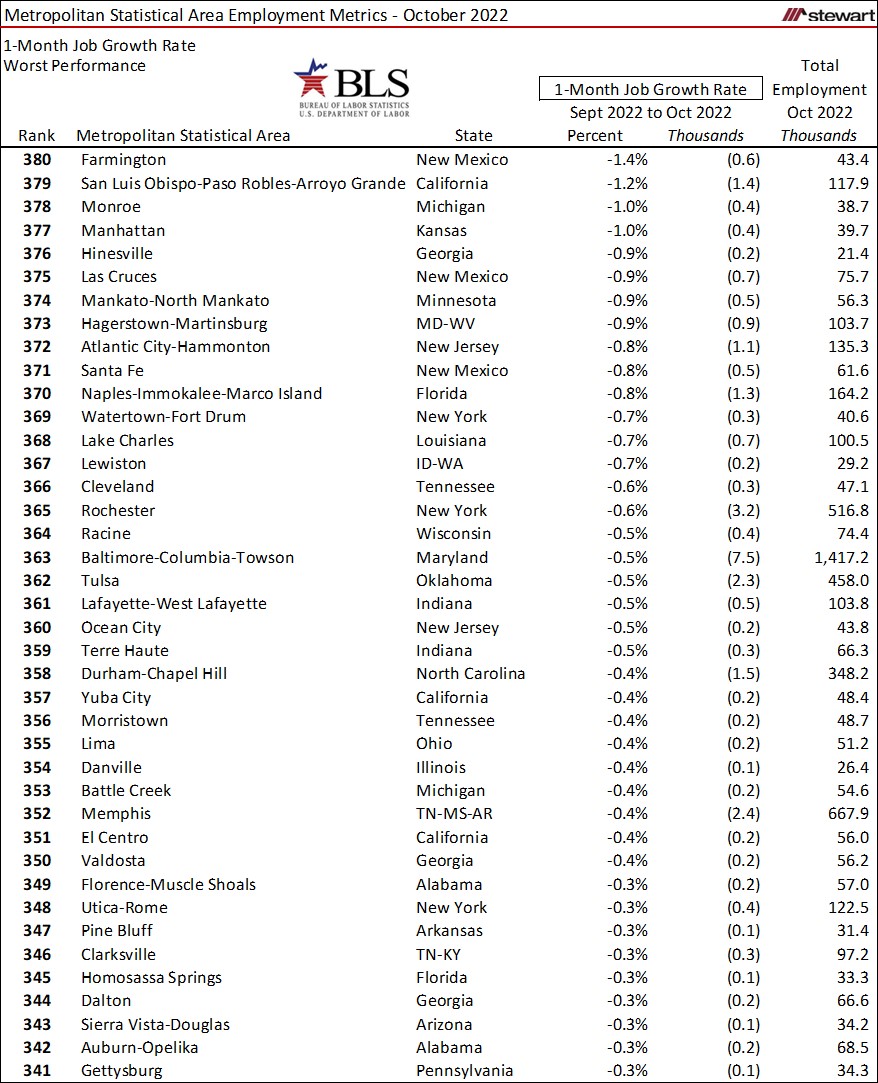
- The last two tables show 1-month job growth rates for 40 best- and worst- performing MSAs.
-
-
- Two PDFs listed here contain the 1-5-10 year job performance and the other the latest 1-month, 12-month and pre-pandemic to October metrics along with other related employment statistics for all 380 MSAs.
- MSA Jobs Oct 2022.pdf
- MSA Jobs 1-5-10 Years Oct 2022.pdf
Jobs are everything, and for many MSAs now a positive talking point regarding the economy and where real estate markets are heading. The potential of a recession in 2023, however, can change these trajectories quickly.
