Now 33.9% Of MSAs Now with as Many or More Jobs Than Ever Before -- April 2022 Job Market Metrics

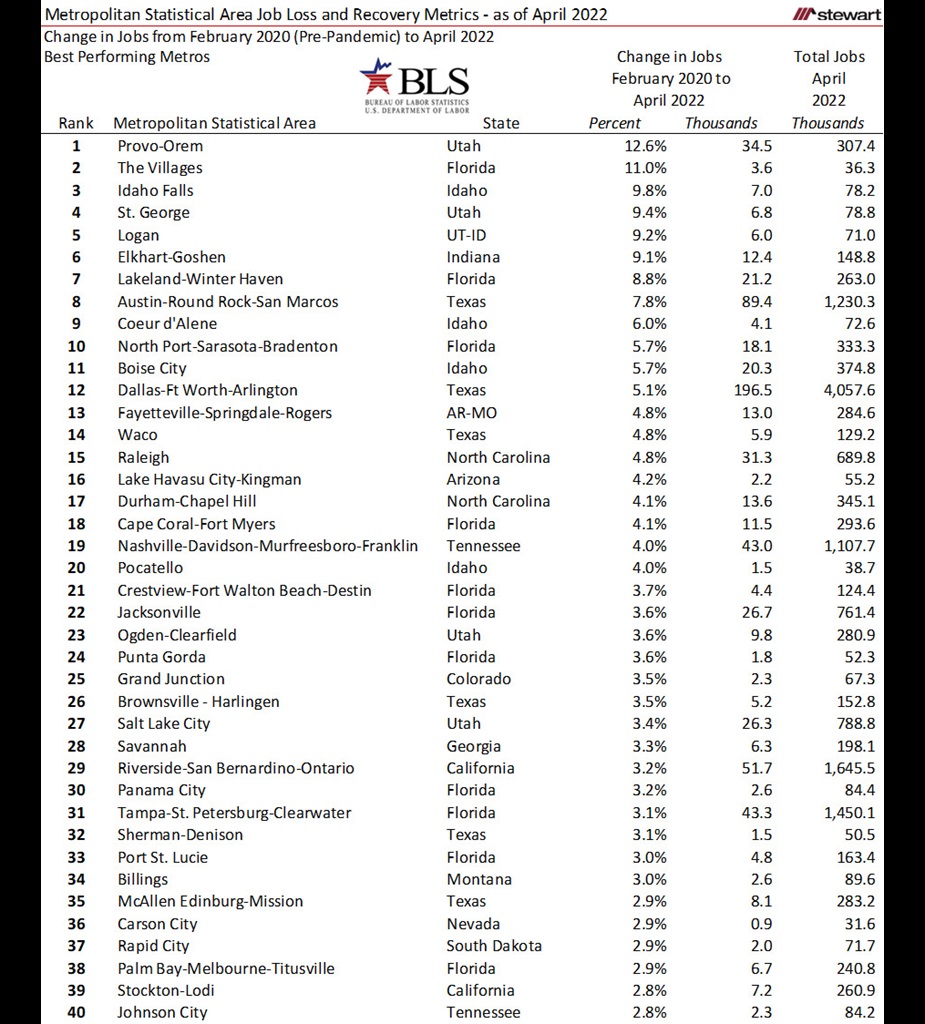
The jobs market recovery from the pandemic continues with 129 of the 380 Metropolitan Statistical Areas (MSAs) now showing as many or more jobs compared to February 2020. These metrics are based on employment statistics as reported by the U.S. Bureau of Labor Statistics (BLS) using seasonally adjusted jobs estimates. There are another 41 MSAs that are within 1.0 percent or less of reaching pre-pandemic employment levels. Although the Census Bureau defines 384 MSAs, the BLS reports monthly seasonally-adjusted data for 380.
The first two tables show the top 80 of the 129 MSAs that are back to pre-pandemic or better job numbers (comparing April 2022 to February 2020 – the month prior to the pandemic). As mentioned last month, impressive is the Provo-Orem, Utah MSA which now has 12.6 percent more jobs than the month prior-to the pandemic. There remains just one other MSA with gains in the double digits, The Villages, Florida MSA, which was up 11.0 percent in the same period. Just one month ago the Provo-Orem MSA was up 11.2 percent and The Villages MSA was third-best in the U.S. at 10.0 percent as these two high-flyers continue to gain altitude. Second best in March was St George, Utah, up 11.0 percent at that time, but fell to third best as of April 2022 after shedding an estimated 300 of the estimated 79,200 jobs (0.4 percent) in the prior 30 days.


The next table shows the 41 MSAs that are within 1.0 percent of returning to pre-pandemic employment numbers along with the number of jobs as of April 2022.

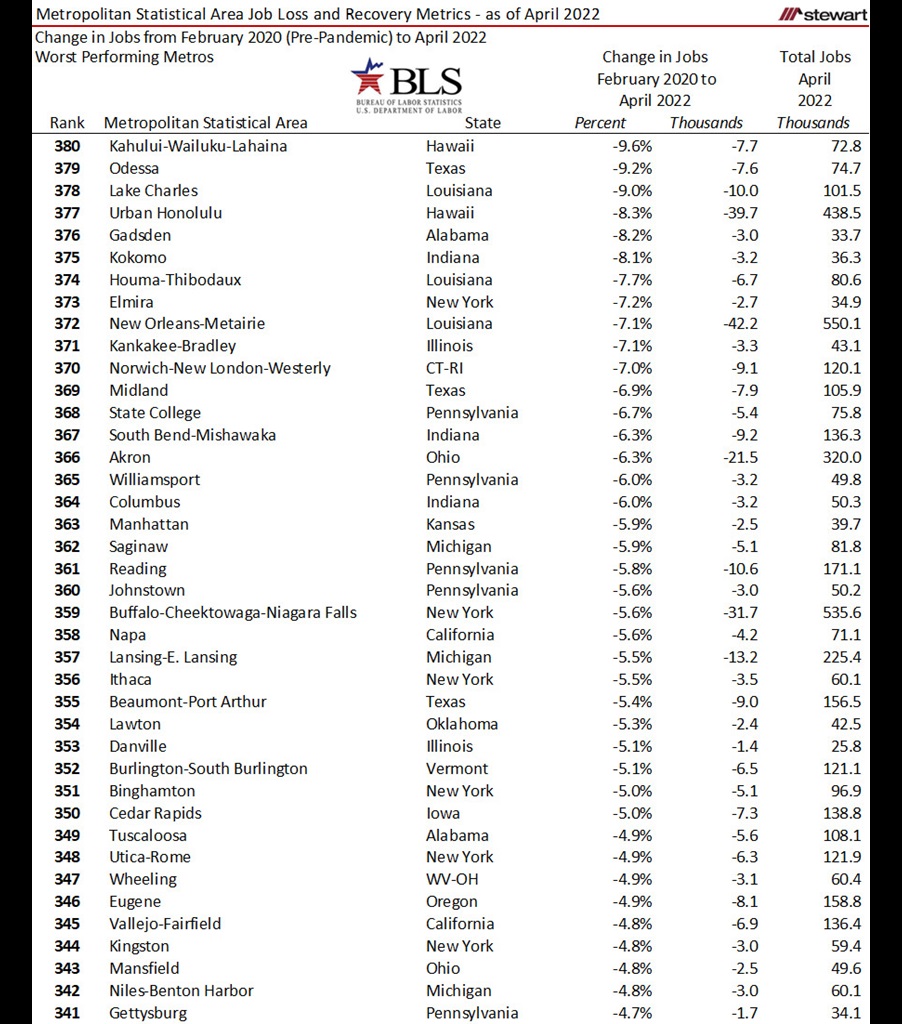
The 80 MSAs with the worst performing job markets spanning February 2020 to April 2022 are shown in the next two tables.


Smaller metros can be more volatile in both job creation and losses when compared to larger cities. In a smaller market, a single employer either hiring or firing can make a material impact on total employment. The next table shows the 40-best recovered job-growth MSAs having at least 200,000 total jobs as of April 2022.

Job performance for the 36 metros with more than 1 million jobs are shown in the next table sorted from best to worst, now 15 having as many or more jobs than ever (41.7 percent).

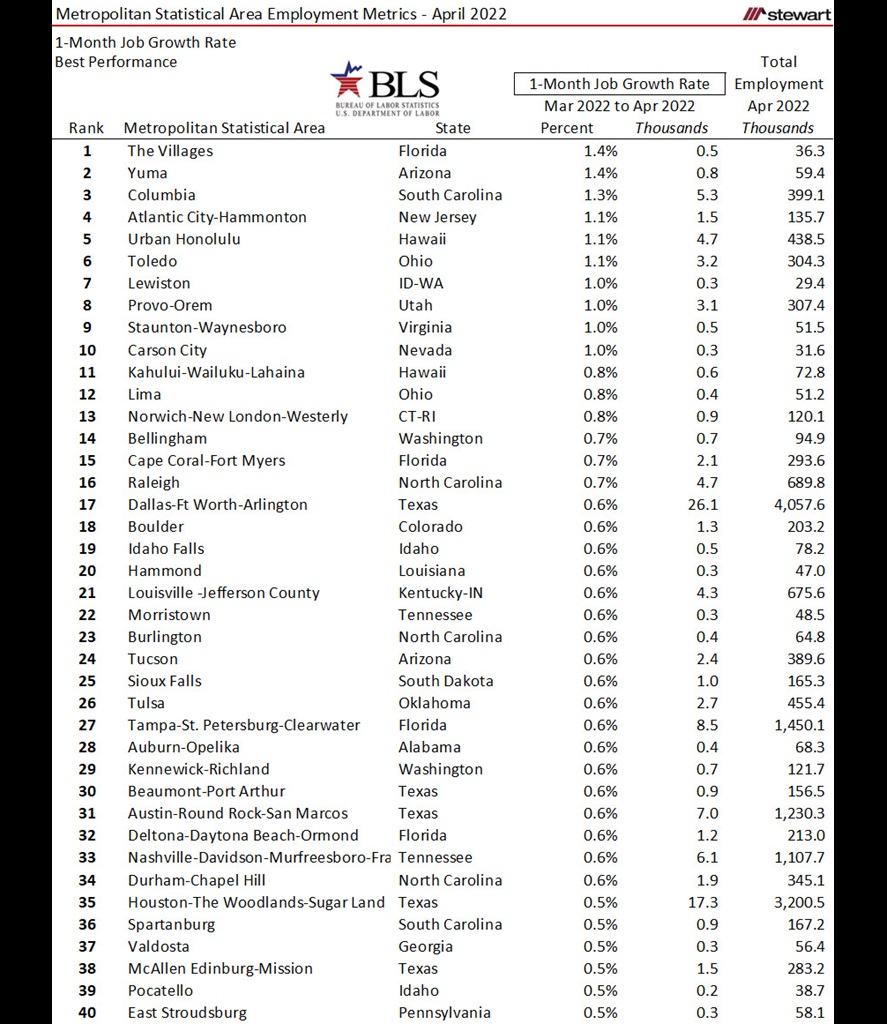
The last two tables detail the 40 MSAs each with the best and worst one-month job gains from March 2022 to April 2022. These span from among the smallest employment markets to the largest.


To access the massive array of employment-related data available from the BLS click https://www.bls.gov/data/#employment
Click here to access the PDF which includes these metrics in addition to 12-month job performance numbers and total employment as of April 2022 for all 380 MSAs, sorted by state.
As stated in the February 2022 version of this blog:
“Just like people, no two metros are identical as their economic DNA varies. Jobs are everything to an economy. Still, after shedding more than 22 million jobs nationwide at the onset of the pandemic, the recovery continues to exceed expectations of most economists and business experts.”
Ted
