
U.S. Job Numbers and Metrics - Pre-pandemic to July 2022

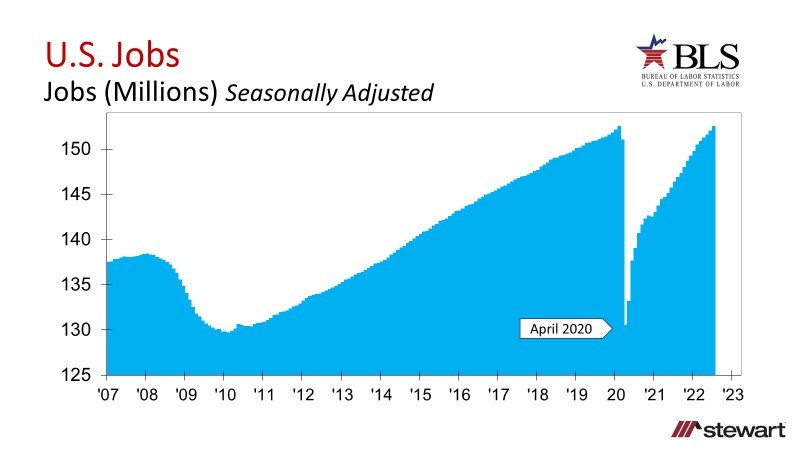
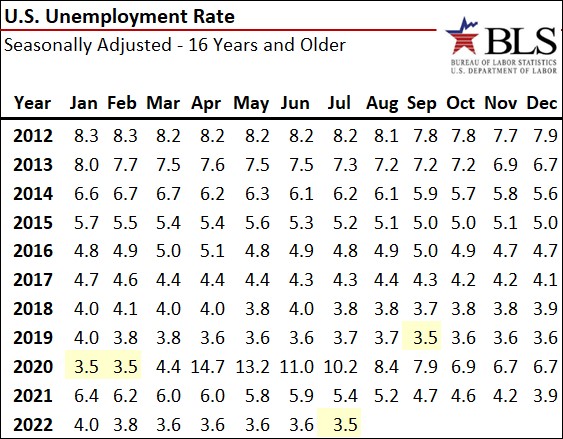
Good news is that the U.S., as of July 2022 and for the first time since the onset of the pandemic, had more jobs than ever before according to the U.S. Bureau of Labor Statistics (BLS). Further great news was the return of the unemployment rate (seasonally adjusted for those aged 16 and up) to the pre-pandemic rate of 3.5 percent. Total employment numbers are shown in the graph and unemployment data are detailed in the first table monthly since the start of 2012.
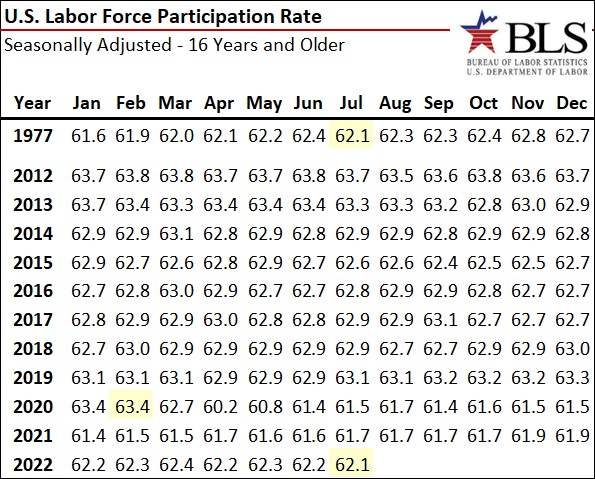
Not all news was good, however. Though the U.S. added 528,000 jobs in July 2022, 303,000 more people were classified as Employed Part-Time for Economic Reasons – which means their work hours were cut due to business conditions or slack work demand. These individuals would prefer fulltime employment but cannot find such a job. The Labor Force Participation Rate (percentage of the population that either has or is actively searching for a job), was 63.4 percent in February 2020 (the month prior to the pandemic), sunk to 61.2 percent as of July 2022. Other than during the pandemic, this is the lowest Labor Force Participation Rate (LFPR) seen since July 1977. If the U.S. had maintained the same LFPR as seen in February 2020 there would be an additional 2.13 million Americans either actively searching for a job or employed today.
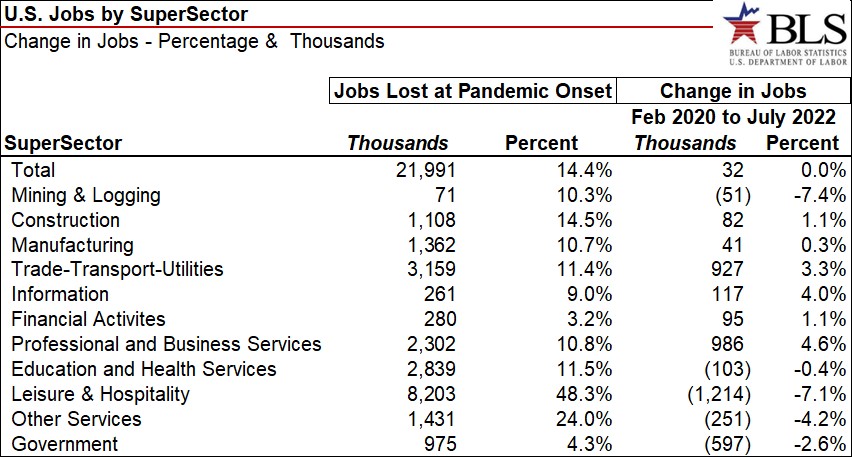
Though the U.S. had more jobs than any month in history in July 2022, that was not true across all of the SuperSectors as defined by the BLS. The next table details SuperSector employment numbers for:
- February 2020 – the month prior to the pandemic
- April 2020 – the low-point of jobs at the onset of pandemic
- July 2022 – latest data available
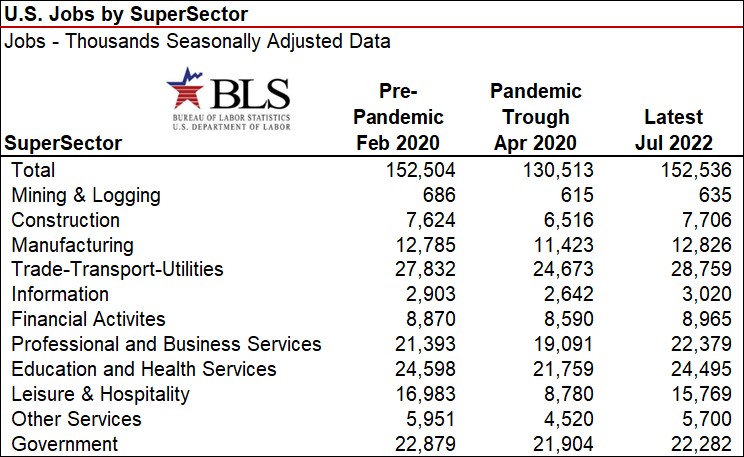
Changes in employment across the SuperSectors are shown in the next table – delineated by thousands of jobs and percentages. The U.S. lost 14.4 percent of all jobs in the first-two months of the pandemic (21.991 million positions) but has brought back or created 32 thousand more net new jobs than compared to February 2020.
Hardest hit SuperSector was Leisure & Hospitality which hemorrhaged 8.203 million jobs or 48.3 percent of the total segment in March and April 2020 and is still down 7.1 percent (1.214 million) compared to the month before the pandemic. The least impacted SuperSectors at the beginning of the pandemic included Financial Activities (down 3.2 percent) and Government (off 4.3 percent). As of July 2022, only four SuperSectors trailed pre-pandemic employment numbers: Mining & Logging -7.4 percent; Leisure & Hospitality -7.1 percent; Other Services -4.2 percent and Government -2.6 percent.
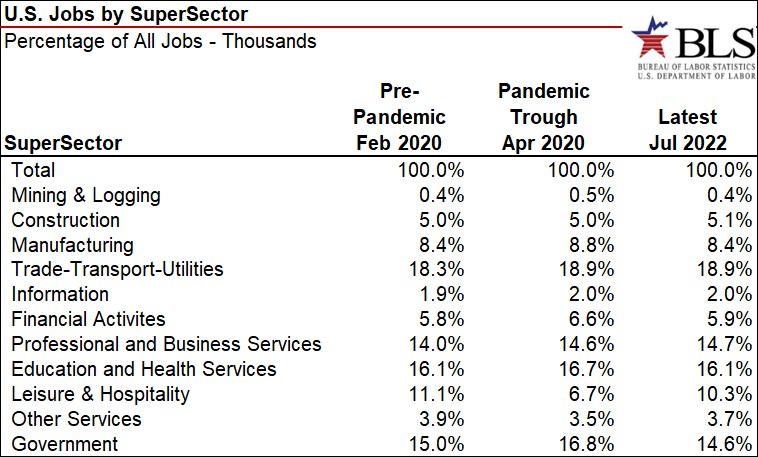
Percent of total employment by Supersector is detailed in the next table.
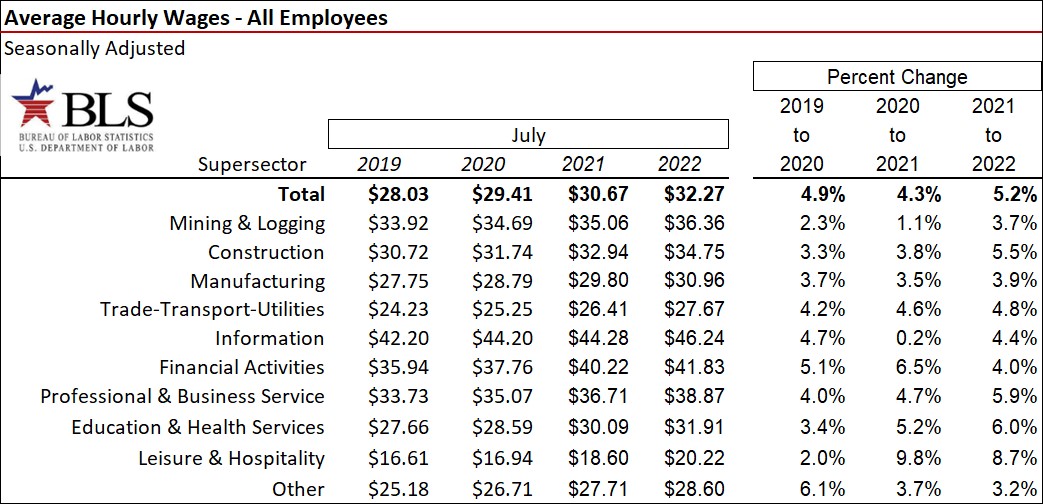
Average hourly wages by SuperSector are shown in the next table with July data for each year from 2019 to 2022. Though average hourly wages rose 5.2 percent from July 2021 to July 2022, inflation jumped 8.5 percent.
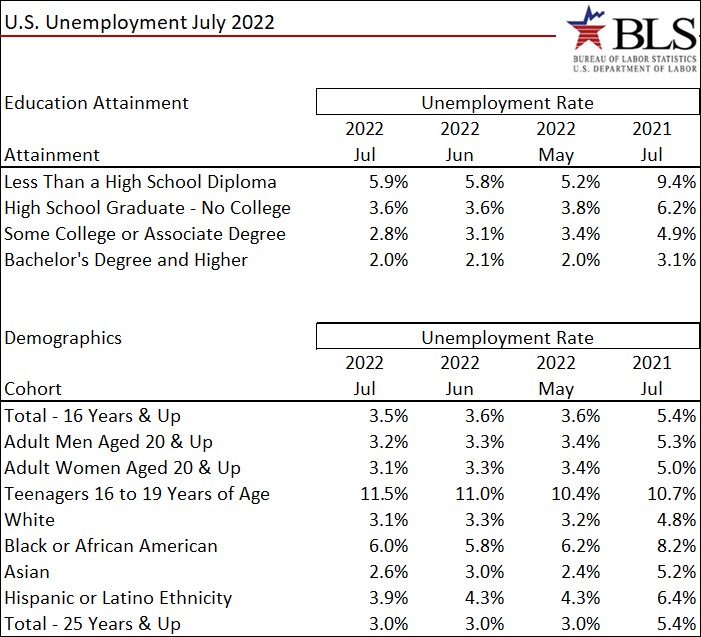
Though the U.S, has returned to the extraordinary low employment level of 3.5 percent, that does not apply to all workers. The last table shows monthly unemployment rates for May, June and July 2022 and July 2021 for select educational and demographic cohorts. Teenagers aged 16 to 19 still have a double digits unemployment rate (11.5 percent). Education wise, those with at least a Bachelor’s degree have just one-third the unemployment rate versus those with less than a High School diploma -- 2.0 percent compared to 5.9 percent. The unemployment rates Black or African American’s at 6.0 percent are more than double the 2.6 percent rate across Asians.
Jobs are everything to the economy with the July 2022 jobs report the best since the onset of the pandemic.
To access the latest jobs report from the BLS click The Employment Situation - July 2022 (bls.gov)
For to a plethora of employment related metrics click https://www.bls.gov/
Ted