
36 States Now Back-to or Better-than Pre-Pandemic Job Numbers

14 States and The District of Columbia Yet to Go
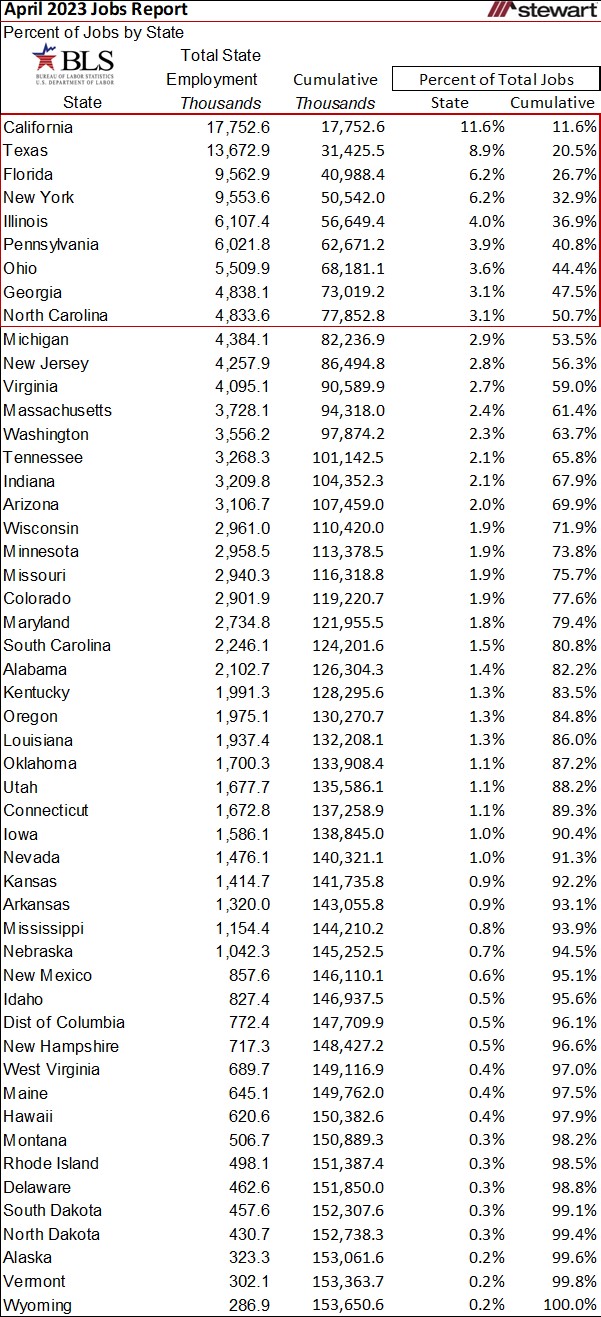
Job recovery from the pandemic plunge now has 36 states with as many or more jobs than ever before according to the Bureau of Labor Statistics (BLS) as of April 2023. Just as states lost differing percentages of jobs in March and April 2020, the recovery rate varies across the geographic landscape. All data discussed are seasonally adjusted data allowing comparison across all months.
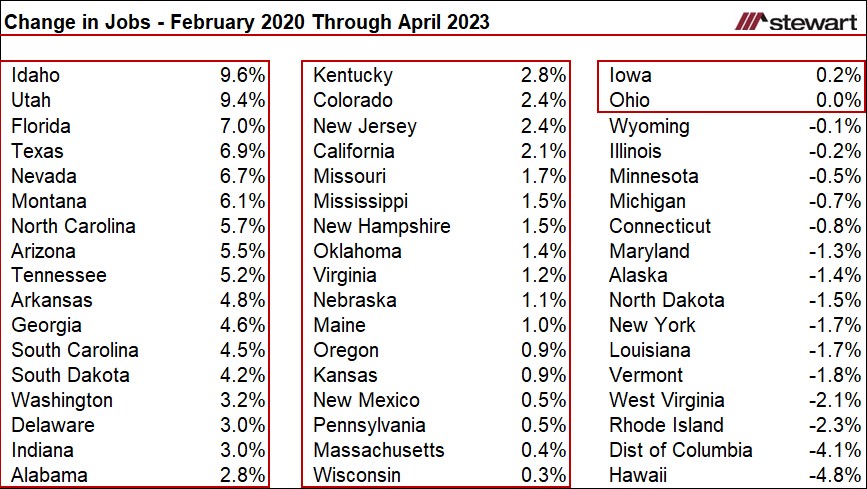
The first table shows the percentage change in jobs from February 2020 (the month prior to the pandemic) compared to April 2023, sorted by relative recovery rates. Also included is the District of Columbia. Idaho and Utah have been the job growth leaders since the pandemic plunge posting gains of 9.6 percent and 9.4 percent, respectively. Hawaii remains the laggard still down 4.8 percent from the month prior to the pandemic, followed by the District of Columbia -4.1%, Rhode Island -2.3%, West Virginia -2.1% and Vermont -1.8%.
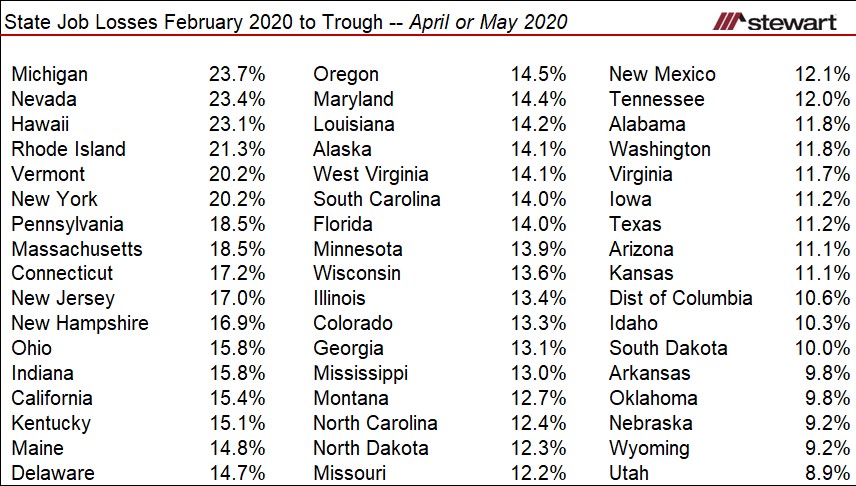
Not all states were equally damaged employment-wise by the pandemic as shown in the next table. From February to April or May in 2020, Michigan lost almost one-in-every-four jobs (-23.7 percent) while Utah shed the fewest at just one-in-every 12 (-8.9 percent).
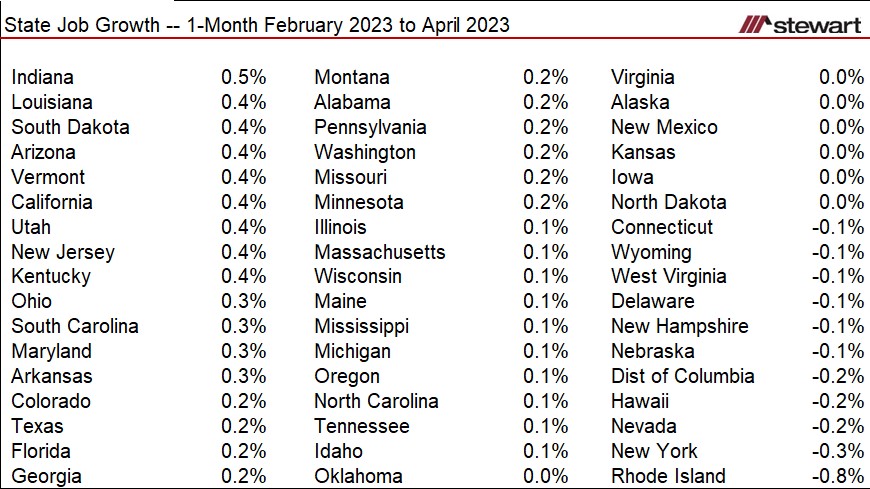
The latest one-month job growth from March to April 2023 is shown in the next table. Thirty-three states posted positive job growth in the 30 days, seven remained the same and 10 states plus the District of Columbia lost jobs. Rhode Island lost the greatest percentage of jobs in the month, three times the loss of New York, with the states down 0.76 percent and 0.26 percent, respectively.
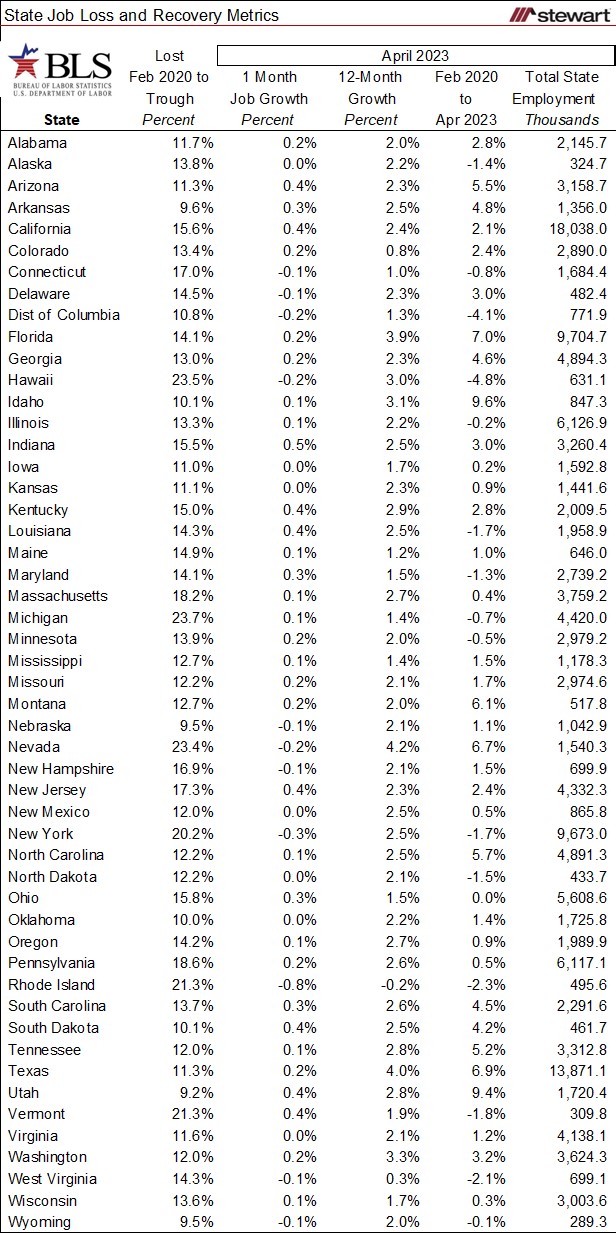
Employment metrics for all 50 states and the District of Columbia are detailed in the next table. Statistics include job growth rates for 1-month (March to April 2023), 12-months (April 2022 to April 2023) and from pre-pandemic to now (February 2020 to through April 2023), plus total employment at the end of April 2023.
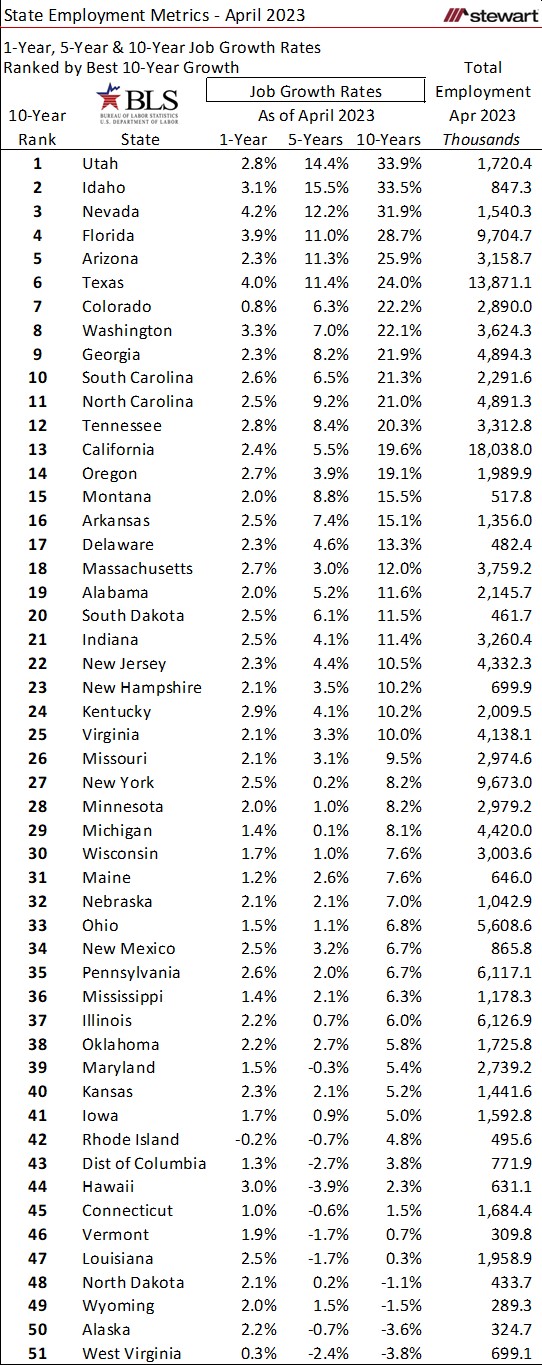
The last table shows state job growth rates for the past one-, five- and 10-years, sorted by percentage gain over 10-years. Long-run job growth shows which economies continue to perform across the economic cycle. Only four states failed to gain jobs in the past 10-years:
- -3.8% West Virginia
- -3.6% Alaska
- -1.5% Wyoming
- -1.1% North Dakota
The BLS provides a plethora of job- and workforce-related data monthly ranging from county to national levels. These data can be accessed at www.bls.gov, then click the DATA TOOLS tab.
Jobs are everything to the economy.
Period.
It’s all about jobs.
Ted