
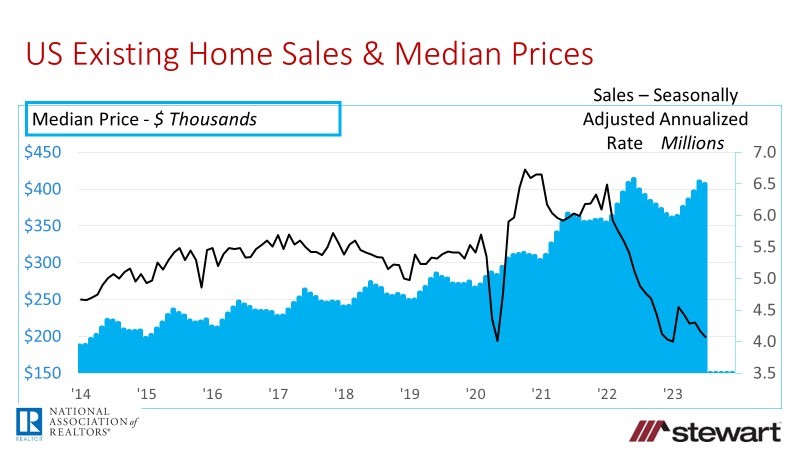
Existing Home Sales Erosion Continues -- Down 16.6% Year-Over-Year on a Seasonally Adjusted Annualized Rate as of July 2023

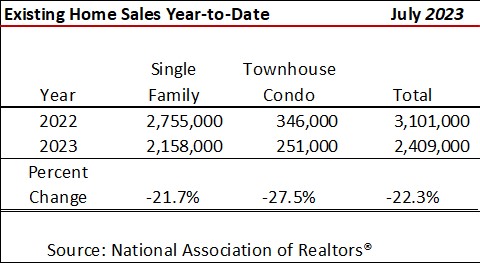
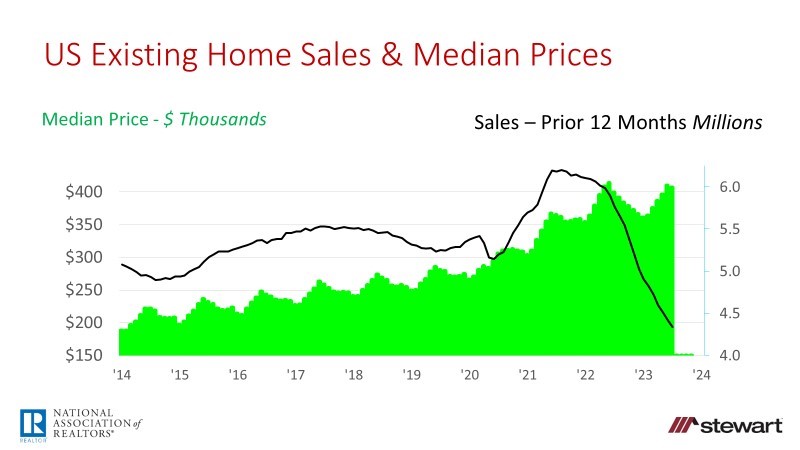
Existing home sales continued to erode in July 2023, down 16.6 percent on a seasonally adjusted annualized rate (SAAR) and off 18.1 percent comparing unadjusted sales in July 2023 year-over-year as reported by the National Association of Realtors® (NAR). Year-over-year sales have now declined for a record 23 consecutive months on a SAAR. Sales year-to-date were down 22.3 percent overall with single-family off 21.7 percent and condo-townhouse sales plunging 27.5 percent. The number of months of inventory rose slightly from 2.8 months in June to 2.9 months on a seasonally adjusted basis. Median price was up a slight 1.9 percent year-over-year to $406,700 in July 2023, with single-family up 1.6 percent ($412,300) and condo-coop median price rising 4.5 percent to $357,600.
Box Score — Existing Home Sales July 2023 National Association of Realtors® (NAR)
Monthly Sales – raw data not seasonally adjusted
- 372,000 for the month of July 2023
- down 14.1 percent sequentially from 433,000 sales in June 2023
- down 18.0 percent year-over-year versus 454,000 sales in July 2022
Seasonally Adjusted Annualized Sales Numbers (SAAR)
- 4.07 million on a SAAR as of July 2023
- down 2.2 percent sequentially from June sales of 4.16 million
- down 16.6 percent year-over-year from 4.88 million in July 2022
Sales Trailing 12 Months – raw data not seasonally adjusted
- 4.334 million for the 12 months ending July 2023 – raw data not seasonally adjusted
- down 24.8 percent vs. 12 months ending July 2022 of 5.765 million
- down 1.9 percent sequentially from June 2023 of 4.416 million
Sales Year-to-Date – raw data not seasonally adjusted
Median Price – July 2023 due to historic monthly seasonality of existing home prices, only a year-over-year comparison is made
- $406,700 – not seasonally adjusted
- up 1.9 percent vs. $399,000 July 2022
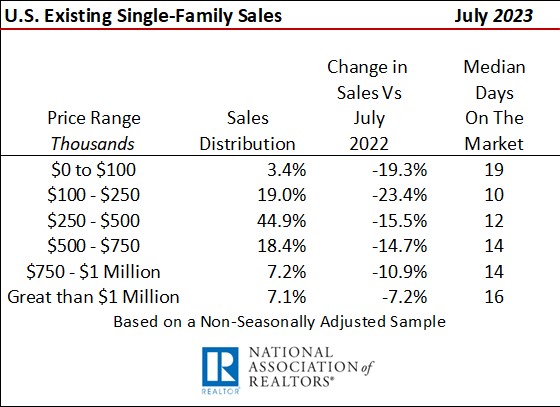
Single-Family Sales by Price and Median Days on the Market Prior to an Accepted Purchase Contract
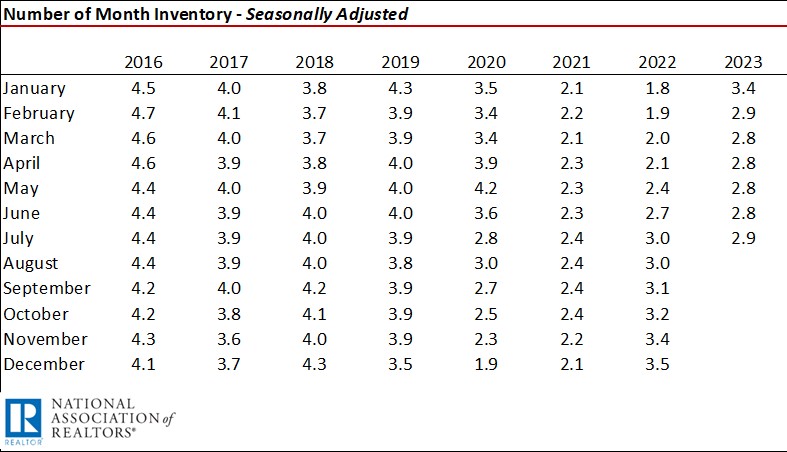
Months Inventory – Seasonally Adjusted
Prior to the pandemic, six months of inventory for existing homes was considered normal. I do believe, however, with the full integration of online home searches and technologies such as virtual home tours, digital signatures and closing aids such as remote online notarizations, the new normal is one-half the pre-pandemic levels. Thus, I would argue that the U.S. overall now is normal in the relative number of listings. The 2.9 months of inventory is not a factor in reduced July 2023 home sales as January 2022 saw 1.8 months inventory with closings at 6.49 million on a SAAR.
Graphs
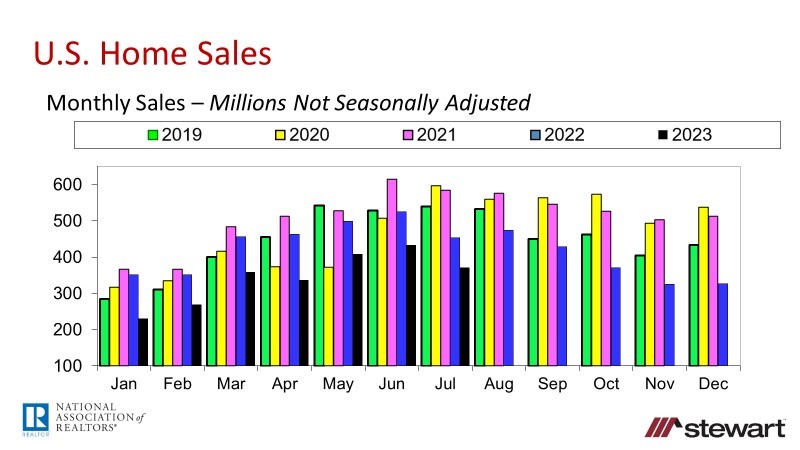
The next graph shows the raw, unadjusted number of monthly home sales annually from 2019 through July 2023. The real comparison is not monthly 2023 sales numbers to 2020, 2021, or 2022 as these data are anomalies due to the pandemic. The only time to look at 2020, 2021, and 2022 data in the future will be in the next pandemic (or similar anomaly) to serve as a gauge in forecasting sales and market behaviors at that time. Since the last normal market was 2019, comparison of 2023 data should be made to that year. Sales in 2023 compared to 2019 have dropped every month this year. The erosion in monthly home sales comparing 2019 to 2023 has been -18.9 percent January, -13.5 percent February, -10.3 percent March, -26.1 percent April, -24.7 percent May, -18.0 percent June, and -31.1 percent as of July. Existing home sales in 2023 are consistently lagging 2019 – the last normal year prior to the pandemic.
Other Details Included in the NAR July 2023 Release
- Listing inventory of 1.11 million units in July 2023 was up 3.7 percent sequentially from June but down 14.6 percent compared to one year ago
- Months Inventory at the end of July 2023 was 3.3 months (not seasonally adjusted) compared to 3.2 months in July 2022
- Typical property was on the market 20 days prior to an accepted purchase contract versus 14 days one year ago and 18 days in June
- Three in four homes closed in July 2023 (74 percent) were on the market less than one month before going under contract
- 1st-time homebuyers accounted for 30 percent of July closings, up slightly from 27 percent in the prior month. Continuing corrosion of affordability will no doubt continue to negatively impact 1st-time homebuyers’ ability to access the great American dream given rising prices and interest rates. Following is a weekly graph of 30-year conventional fixed-rate mortgages as reported by Freddie Mac’s weekly Primary Mortgage Market Survey (PMMS). Conventional mortgage rates came in at 7.23 percent the week ending August 24, the highest seen since April 2002—more than 21 years ago.

- Investors purchased 16 percent of the homes sold in July 2023 versus 14 percent in the same month last year
- Buyers paid all cash in one in every four sales (26 percent), similar to the 24 percent a year ago
- Distressed sales—foreclosures and short sales—remained at 1 percent of all closings, unchanged sequentially and year-over-year
To read the full press release from NAR click nar.realtor/newsroom/existing-home-sales-slipped-2-2-in-july.
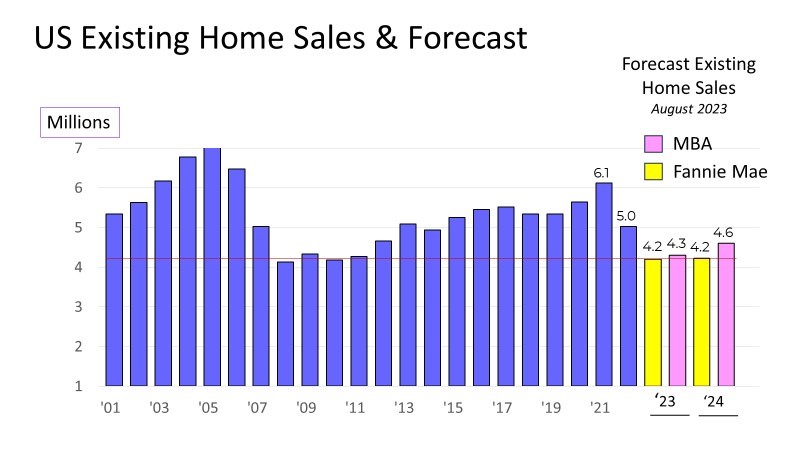
Fannie Mae anticipates 4.21 million existing home sales in 2023 with median price up 3.9 percent while the MBA sees 4.30 million sales with price up a minimal 0.8 percent. The last graph shows Fannie Mae and MBA existing home sales forecasts for the remainder of 2023 and full-year 2024.
Follow me on Twitter at twitter.com/DrTCJ
Ted