Existing Home Sales Plunge 35 Percent in November 2022 and Inventory Hits a 29-Month Peak

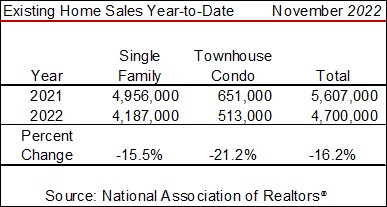
Existing home sales plunged 35 percent in November 2022 on a year-over-year basis for both the month (on an unadjusted basis) and on the seasonally adjusted annualized rate (SAAR) according to the National Association of Realtors® (NAR). Sales have now declined for 10-consecutive months on a SAAR for the first time in history. Sales year-to-date were off 16.2 percent overall with single family down 15.5 percent and condo-townhouse slipping 21.2 percent.
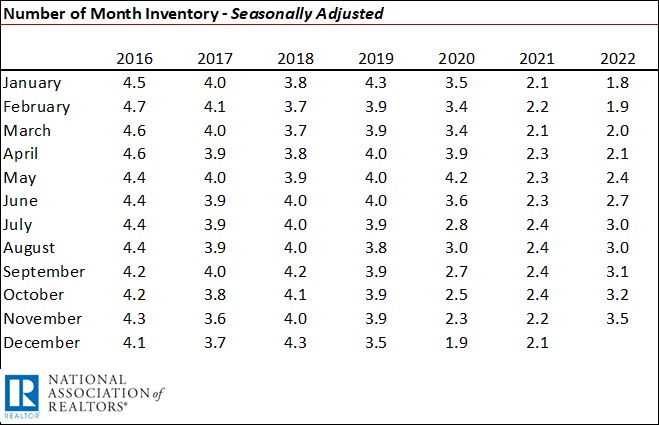
The number of months of inventory ratcheted up to 3.5 months on a seasonally adjusted basis, the most seen in the past 29 months -- since June 2020.
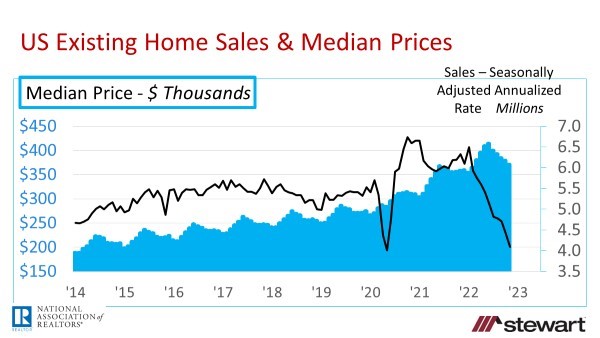
Median price was up 3.5 percent to $370,700 in November from one-year ago but was down from the June 2022 all-time record high of $413,800. Still, median prices have increased 129 consecutive months on a year-over-year basis, the longest upside streak in history.
Box Score -- Existing Home Sales November 2022 National Association of Realtors® (NAR)
Monthly Sales – raw data not seasonally adjusted
326,000 for the month of November 2022
down 12.1 percent sequentially versus the 371,000 sales in October 2022
down 35.2 percent year-over-year versus the 503,000 sales in November 2021
Seasonally Adjusted Annualized Sales Numbers (SAAR)
4.09 million SAAR as of November 2022 – the fewest since May 2020 at the onset of the pandemic
down 7.7 percent sequentially from October 2022 sales of 4.43 milliondown 35.4 percent year-over-year from 6.33 million in November 2021
Sales Trailing 12-Months – raw data not seasonally adjusted
5.21 million for the 12-months ending November 2022 – raw data not seasonally adjusted
down 15.2 percent vs 12-months ending November 2021 of 6.15 million
down 3.3 percent sequentially from October 2022 of 5.39 million
Sales Year-to-Date – raw data not seasonally adjusted
Median Price – November 2022 | due to historic monthly seasonality of existing home prices, only a year-over-year comparison is made
$370,700 – not seasonally adjusted
up 3.5 percent vs $358,200 November 2021
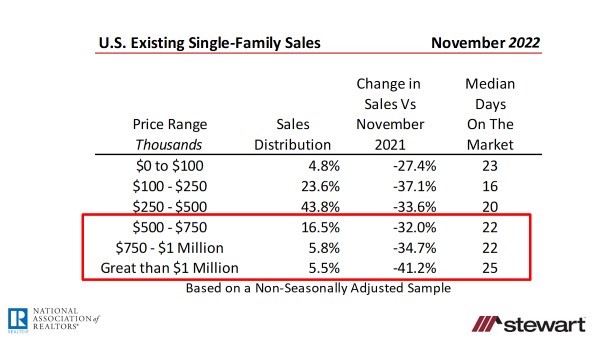
Single-Family Sales by Price and Median Days on the Market Prior to an Accepted Purchase Contract
Since July 2022 sales have been down year-over-year in each and every price range reported by NAR.
Months Inventory – Seasonally Adjusted
Prior to the pandemic, 6 months of inventory for existing homes was considered normal. I do believe, however, with the full integration of online home searches and technologies such as virtual home tours, digital signatures and closing aids such as remote online notarizations, the new normal is one-half the pre-pandemic levels. Thus I would argue that the U.S. overall now is normal in the relative number of listings. The current months of inventory of homes available for sale is the most in 29 months. The number of months of inventory is not a factor in November reduced home sales as January 2022 saw 1.8 months inventory with sales at 6.49 million on a SAAR.
Graphs

The seasonally adjusted annualized sales rate of 4.09 million in November 2022 was the lowest seen since May 2020 after the U.S. shed a record 22 million jobs from March to April as the pandemic progressed.
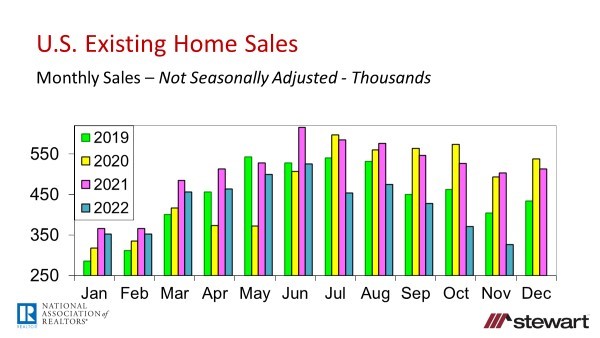
The next graph shows the raw, unadjusted number of monthly home sales annually from 2019 through November 2022. The real comparison is not monthly 2022 sales numbers to 2020 or 2021 as these data are anomalies due to the pandemic. The only time look at 2020 and 2021 data in the future will be in the next pandemic to serve as a gauge in forecasting sales and market behaviors at that time. Since the last normal market was 2019, comparison of 2022 data should be made to 2019. Sales in 2022 have dropped for five consecutive months sequentially. The erosion in monthly home sales comparing 2019 to 2022 has been -15.9 percent in July, -10.9 percent in August, -4.9 percent in September, -19.7 percent in October, and -19.3 percent in November.
Other Details Included in the NAR November 2022 Release
Listing inventory of 1.14 million units in November 2022 was down 6.6 percent sequentially from October but up 2.7 percent compared one-year ago
Months Inventory at the end of November 2022 was 3.3 months (not seasonally adjusted) compared to 2.1 months in November 2021
Typical property was on the market 24 days prior to an accepted purchase contract versus 18 days one-year ago
61 percent of homes closed in November 2022 were on the market less than one month before going under contract
1st time homebuyers accounted for 28 percent of November closings, up slightly from 26 percent one-year ago. Continuing erosion of affordability will no doubt negatively impact 1st-time homebuyers ability to access the great American dream given rising prices and interest rates. CNN reported that according to NAR’s 2022 Profile of Home Buyers and Home Sellers the percentage of 1st-time homebuyers plunged to a record-low 26 percent, down from 36 percent a year ago
Investors purchased 14 percent of the homes sold in November 2022 versus 15 percent in the same month last year
Buyers paid all-cash in one-in-every-four sales (26 percent), similar to 24 percent one-year ago
Distressed sales – foreclosures and short sales – edged up to 2 percent
Click here to read the full press release from NAR.
Economic conditions (inflation) and challenging affordability now control the destiny of the U.S. housing market.
Inflation - Recent months have seen the highest inflation rate in 40 years which peaked at 9.1 percent in June and has cooled slightly to 7.1 percent as of November. The US Congress Joint Economic Committee estimated current inflation is costing households $747 per month more since January 2021 (or $8,963 in the coming 12-months) when inflation was last in a normal range. At the now 6.27 percent 30-year conventional mortgage rate (per Freddie Mac), a monthly payment of $747 would service a $121,066 loan. Conventional 30-year fixed-rate mortgage rates have more than doubled from the all-time record low of 2.65 percent in January 2021.
Recession Outlook – Good news is the final estimate for Q3 2022 GDP annualized, inflation-growth came in at a strong 3.2 percent. Bad news is that many (but not all) analysts expect a recession in 2023:
Fannie Mae – modest recession will commence in Q1 2022
Bloomberg – probability of a recession is now 100 percent within a year
PIMCO – recession more likely than not but mild
JPMorgan – mild recession in 2023
Forbes – recession will begin late 2022 or early 2023
S&P Global – mild recession early next year with recovery in the 2nd half of 2023
Former Boston Fed President Eric Rosengren – U.S. likely headed to mild recession in 2023
FitchRatings – recession to start in Q2 2023
University of Michigan Economists – mild recession ahead in 2023
World Bank – risk of global recession in 2023
As consumers anticipate a downturn they buy less which causes the recession.
Affordability – the November 2022 forecasts from the MBA and Fannie Mae for median home prices and interest rates in 2023 calls for the monthly principal and interest payment for a household buying the typical home to increase from 2020 to 2023 by 57.3 percent to 69.4 percent, respectfully. Average wages from 2020 to 2022 rose just 9.4 percent in comparison.
Home Sales Pipeline – NAR Pending Home Sales November 2022 | The just-released National Association of Realtors’ Pending Home Sales Index (newly signed home-purchase contracts) for November 2022 was down 37.8 percent compared to 1-year ago and off 4.0 percent sequentially from October. Pending home sales typically make up closings for the next 90 days and have been down now six consecutive months. The November reading was the second lowest in the past 20 years, with the lowest posted in April 2020 at the trough of the pandemic.
Although NAR is forecasting 4.78 million existing home sales with stable prices in 2023, there continues to be nothing on the economic radar indicating the shrinking home sales trend will change significantly in the coming six to 12 months. A 35 percent cut in demand coupled with increased supply sets the stage for declining values and prices.
Follow me on Twitter at https://twitter.com/DrTCJ
Ted
