Job Gains Hiccup in June 2023 But Unemployment Rate Nudges Down From 3.7 Percent to 3.6 Percent

The U.S. added 209,000 net new jobs on a seasonally adjusted basis in June 2023, missing market expectations of 240,000. This was the smallest gain since 268,000 jobs were lost in December 2020. The Bureau of Labor Statistics (BLS) reported that unemployment slipped slightly to a less-than-normal 3.6 percent and that hourly wages were up 4.4 percent in the past 12 months and up 0.4 percent in the past month to $33.58. May employment numbers were revised downwards to 306,000 (a drop of 33,000 from the preliminary estimate) and April was restated down by 77,000. Average monthly job gains in the first six months were 278,000 compared to 399,000 in the same period a year ago.
Note: Tables and graphs use seasonally adjusted data—except the last two tables, which are not seasonally adjusted. All data are from the BLS.
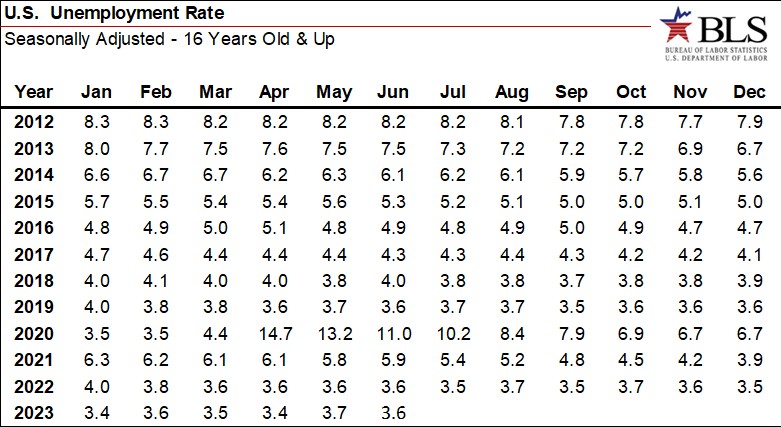
Total employment numbers monthly are shown in the graph commencing 2007, with unemployment data detailed in the table commencing 2012. The current unemployment rate is one-third the level posted in the same month at the onset of the pandemic. Prior to the pandemic, the Federal Reserve viewed full employment when the unemployment rate ranged from 5.0 percent to 5.5 percent.
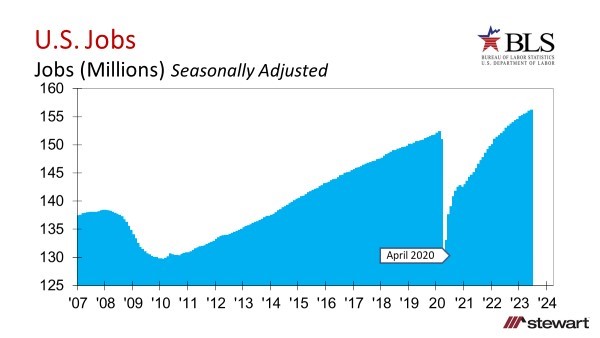
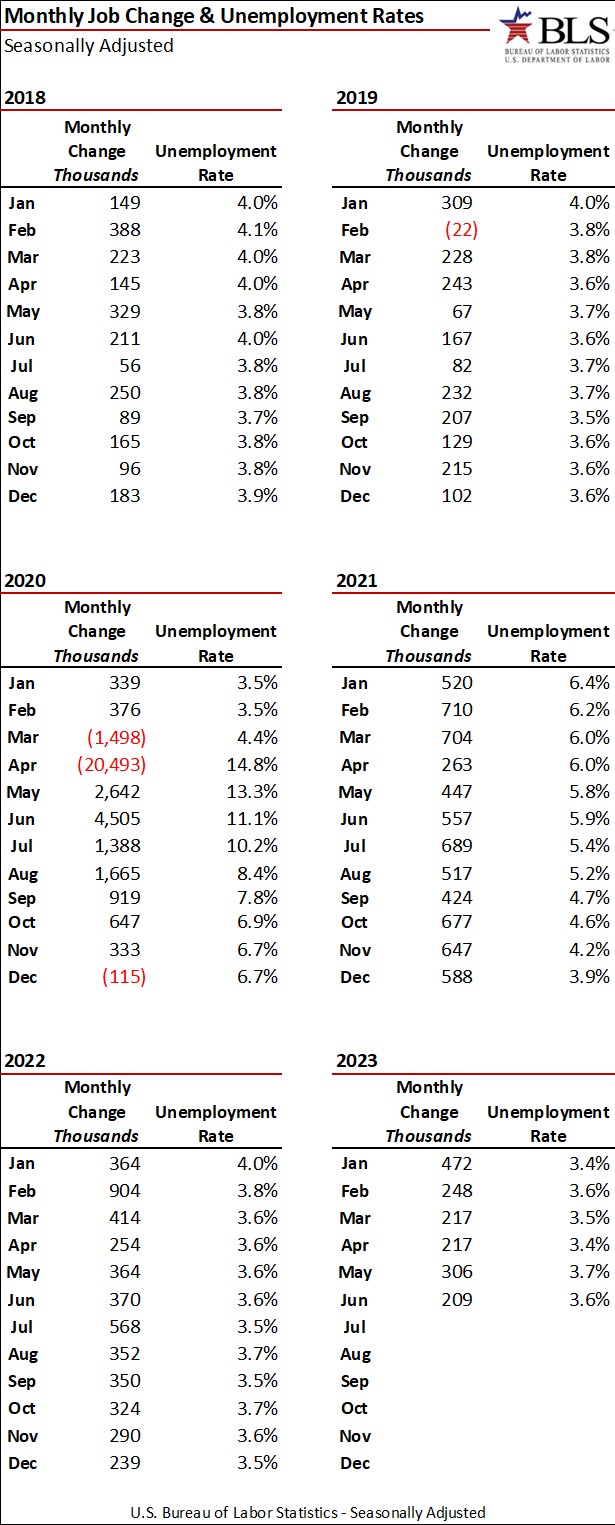
Monthly job gains (losses) and the corresponding unemployment rates (both seasonally adjusted) are detailed in the next table. Unlike the 2008 recession, this recovery was far quicker even though the drop in total number of jobs was almost three times as severe.
Tough news, however, was that 4.191 million workers with jobs were classified as Employed Part-Time for Economic Reasons in June—which means their work hours were cut due to business conditions or slack work demand. There was an increase of 452,000 in this category from May to June as the economy softened. These workers would prefer full-time employment but cannot find a full-time job.
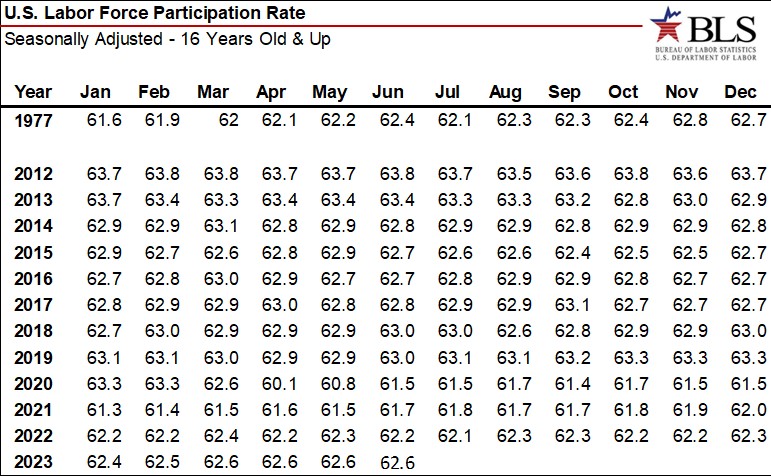
The Labor Force Participation Rate (LFPR—the percentage of the population that either has or is actively searching for a job) was 63.3 percent in February 2020 (the month prior to the pandemic) and averaged 63.0 percent from 2012 through 2019. After sinking to 60.1 percent in April 2020 at the onset of the pandemic, it has recovered to 62.6 percent, remaining unchanged in the past four months. If the U.S. had maintained the same LFPR as seen in February 2020, there would be almost 1.2 million Americans either actively searching for a job or employed today.
SuperSectors are the defined types of jobs by the BLS. Changes across the SuperSectors as a percentage of all jobs are shown in the next table—monthly for June from 2019 through 2023.
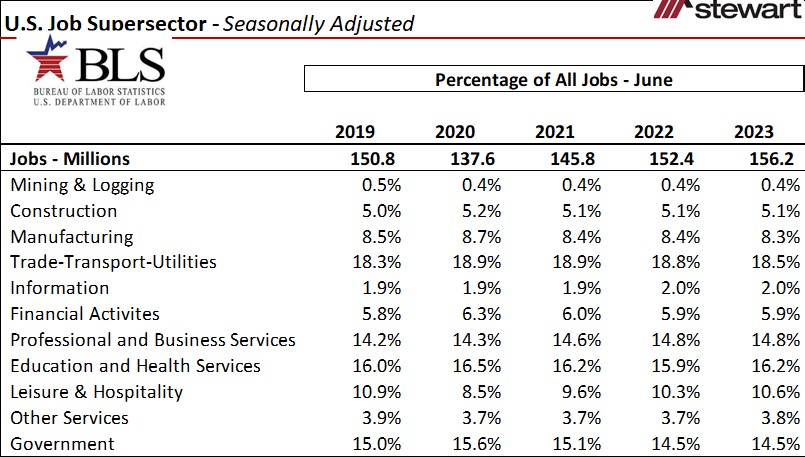
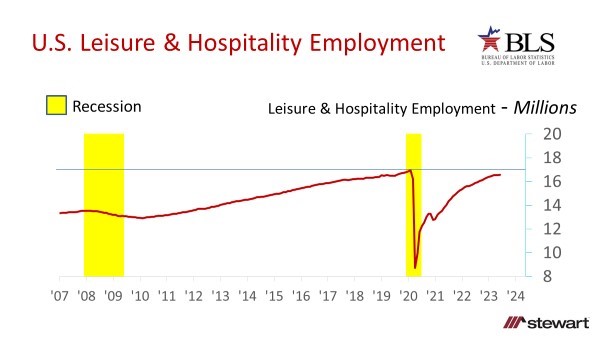
Most impacted SuperSector at the start of the pandemic was Leisure & Hospitality, which hemorrhaged 8.203 million jobs or 48.3 percent of the total segment in March and April 2020. This sector added a minuscule 21,000 jobs in June 2023 and is still short 369,000 jobs when compared to February 2020, despite a robust travel, food services, and beverage economy.
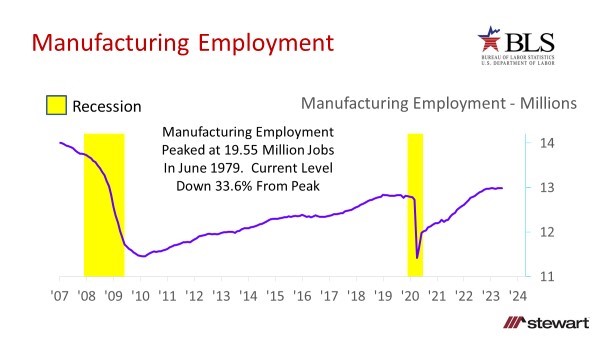
Good news is that manufacturing employment now has more jobs than February 2020—the month prior to the pandemic. Bad news is that manufacturing employment as of June 2023 was 33.6 percent less than the peak notched in June 1979.
Employment in real estate activities—which does not include lending or construction—is shown in the next graph. These are jobs classified by the North American Industry Classification System (NAICS) as Real Estate starting with the 55531 code. This includes:
- Lessors of Real Estate
- Offices of Real Estate Agents and Brokers
- Activities Related to Real Estate
- Residential Property Management
- Non-Residential Property Management
- Appraisers
- Others
Not only does the Real Estate segment of NAICS have more workers today than any time since 2007, the 1.854 million current jobs in the segment is the most recorded since the Real Estate segment data collection commenced in 1990.

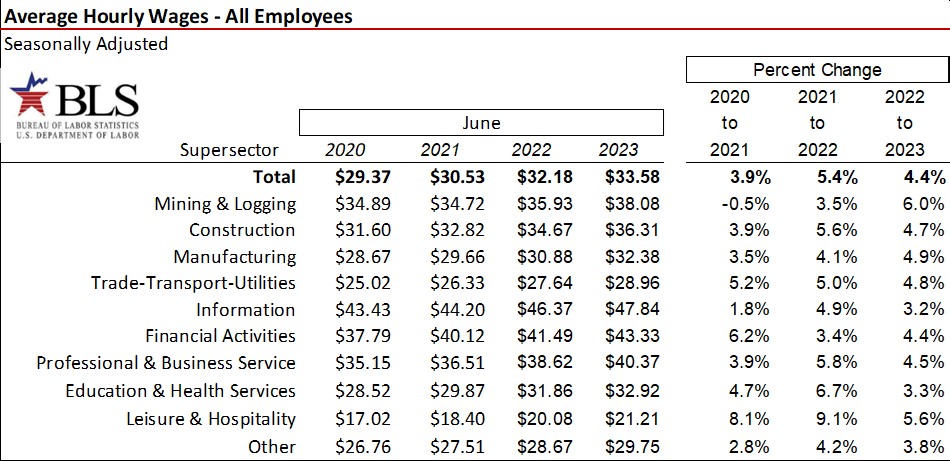
Average hourly wages for the U.S. and by SuperSector are shown in the next table with June data for each year from 2020 to 2023. Average hourly wages rose 4.4 percent from June 2022 to June 2023 while inflation jumped 4.1 percent (each stated on a seasonally adjusted rate). The largest hourly wage gain in the past year was in the Mining & Logging Sector, up 6.0 percent. The worst performer was the Information Sector at 3.2 percent. That sector, however, posted the highest hourly wage of $47.84.
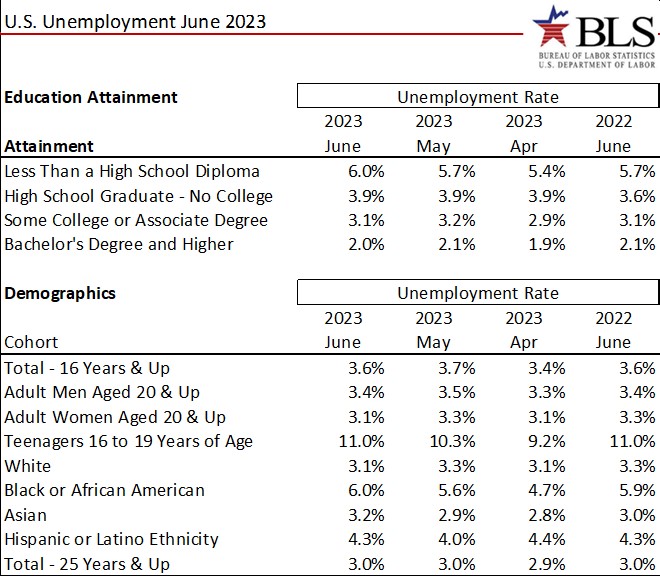
Despite a lower-than-normal unemployment level of 3.6 percent, that unfortunately does not apply to all workers. The next table shows monthly unemployment rates for April, May, and June 2023 along with June 2022 for select educational and demographic cohorts. Teenagers from 16 to 19 years old have a double-digit unemployment rate at 11.0 percent—more than triple the national level. Education-wise, those with at least a Bachelor’s degree have one-third the unemployment rate compared to those with less than a high school diploma—2.0 percent versus 6.0 percent. The unemployment rate for Black or African Americans at 6.0 percent was almost double the 3.2 percent rate for Asians.
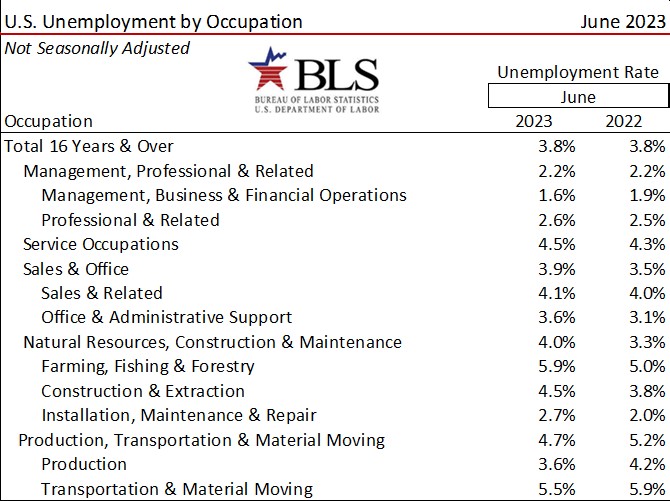
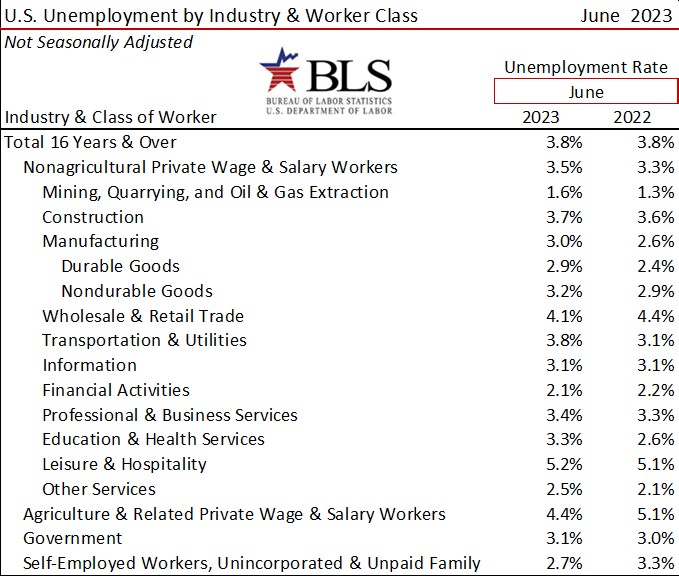
The last two tables detail unemployment rates by Occupation and Industry and Worker Class. As these data are only available not seasonally adjusted, they can only be accurately compared to data within the same current month or a year-over-year basis.
To access the latest jobs report from the BLS click The Employment Situation - June 2023 (bls.gov).
For a plethora of employment and income-related metrics click www.bls.gov/data/home.htm.
Jobs are everything to the economy, with mixed messages embedded in the June 2023 jobs report. While job growth slowed slightly, the unemployment rate tightened a smidge. Most market observers still believe this jobs report serves as a basis for two more rate increases by the Fed.
Jobs are everything—and the U.S. has more than ever before.
Ted
