
MSA Job Performance Metrics May 2023

Jobs are everything to the economy. The ultimate effective demand for real estate is a direct function of jobs. Ditto the demand for real estate brokers and agents, lenders, title companies, property inspectors, appraisers, and others involved in the real estate transaction business.
Good news is that, after losing 22 million jobs in March and April 2020 at the onset of the pandemic, the U.S. now has more jobs than in February 2020 – the month prior to the pandemic. Bad news is that, just like the geographic landscape differs across the country, so does the economic job landscape.
The U.S. Bureau of Labor Statistics monthly releases employment data covering 380 Metropolitan Statistical Areas (MSAs). The following metrics are based on the latest data from May 2023 and use seasonally adjusted numbers, which allows comparison of any month to all others. Good news is that 65.3 percent of MSAs (248 of the 380) now have more jobs than February 2020 – the month prior to the pandemic. Four MSAs (1.1 percent) have the same number of jobs as February 2020, and 128 (33.7 percent) have fewer jobs when compared to the month prior to the pandemic.
The first table shows the 38 metros (top 10 percent of all MSAs) having the greatest percentage of job growth from February 2020.
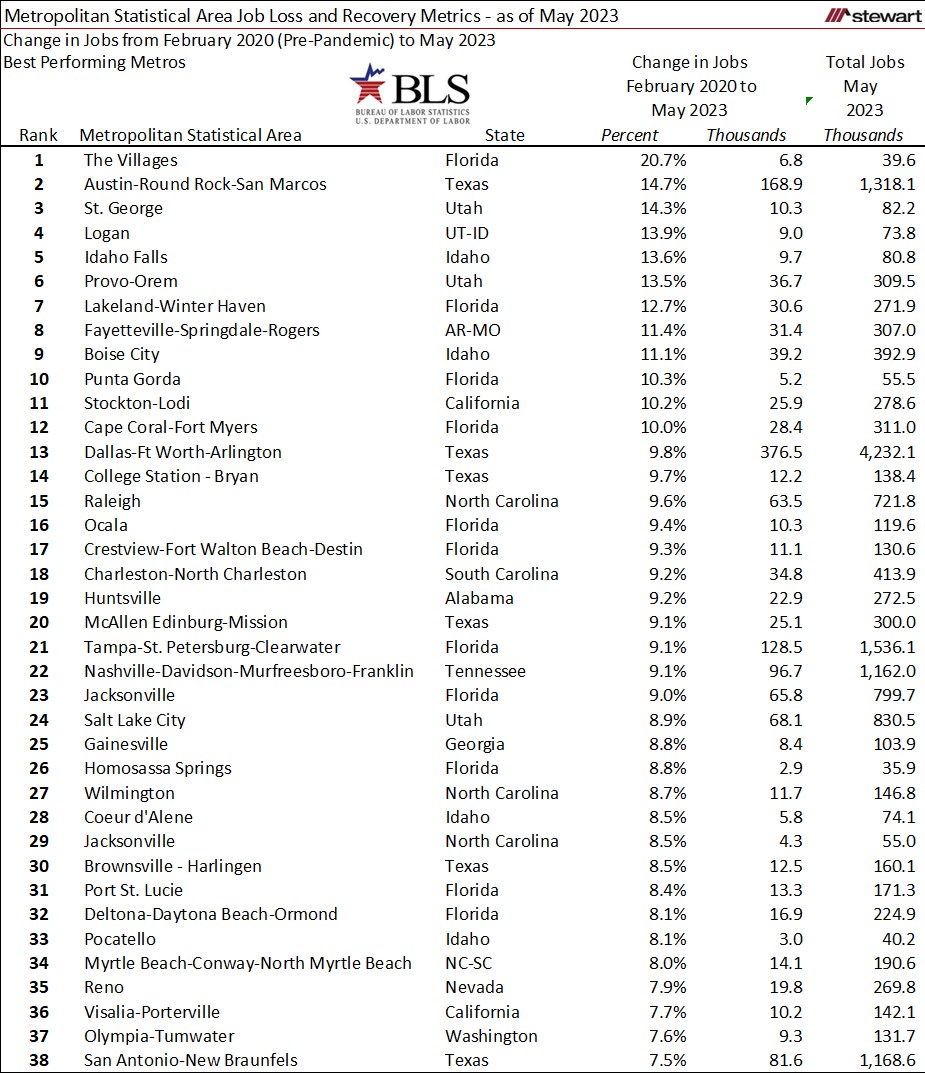
Among the top 38 MSAs for job growth from February 2020 to May 2023, 11 are located in Florida, six in Texas, and four each in Idaho, North Carolina, and Utah. The next table shows those states with at least four in the top 38 along with the number and percentage of all state MSAs. Utah and Idaho each have five total MSAs with four of those included in the top 10 percent of job growth rates from February 2020 to May 2023. One-half (50 percent, or 11 of the 22 total Florida MSAs) are also included in the top 10 percent of pre-COVID to now job gains; 30.8 percent of North Carolina and 24 percent of Texas.

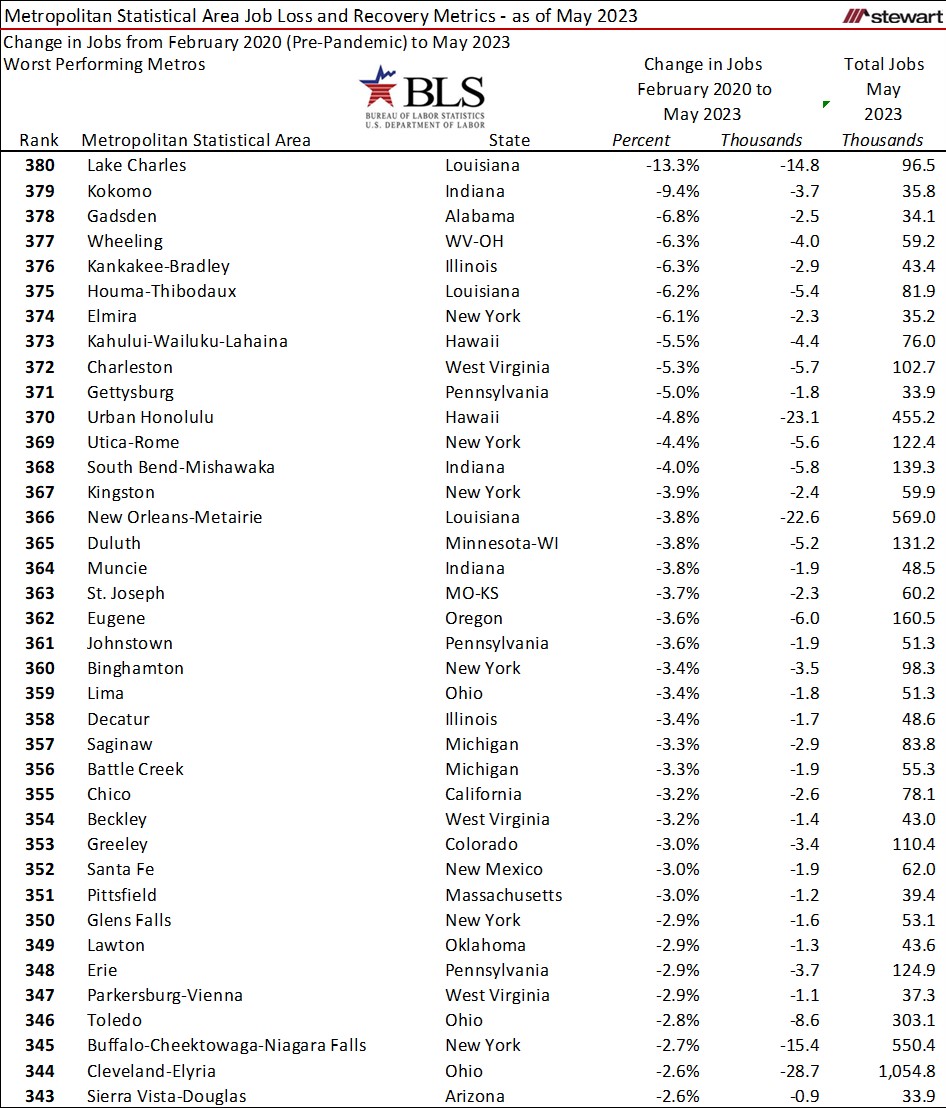
The worst performing 38 MSAs from February 2020 to May 2023 are detailed in the next table. New York leads the bottom with six of the 38 weakest job-performing MSAs (15.8 percent of the bottom 38), followed by West Virginia and Louisiana with four each.
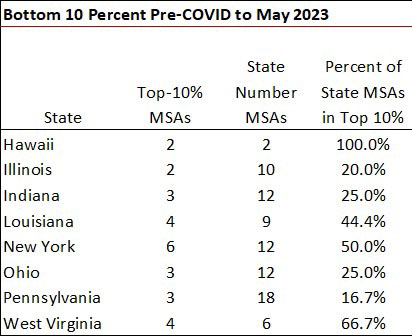
The perspective of these metrics changes with the inclusion of the total number of MSAs in the state, as shown in the next table. Hawaii has both the state’s MSAs included in the bottom 10 percent, while New York, with six MSAs in the bottom, has just 50 percent included. West Virginia job recovery struggles given two-thirds of the state’s MSAs are in the bottom 10 percent.
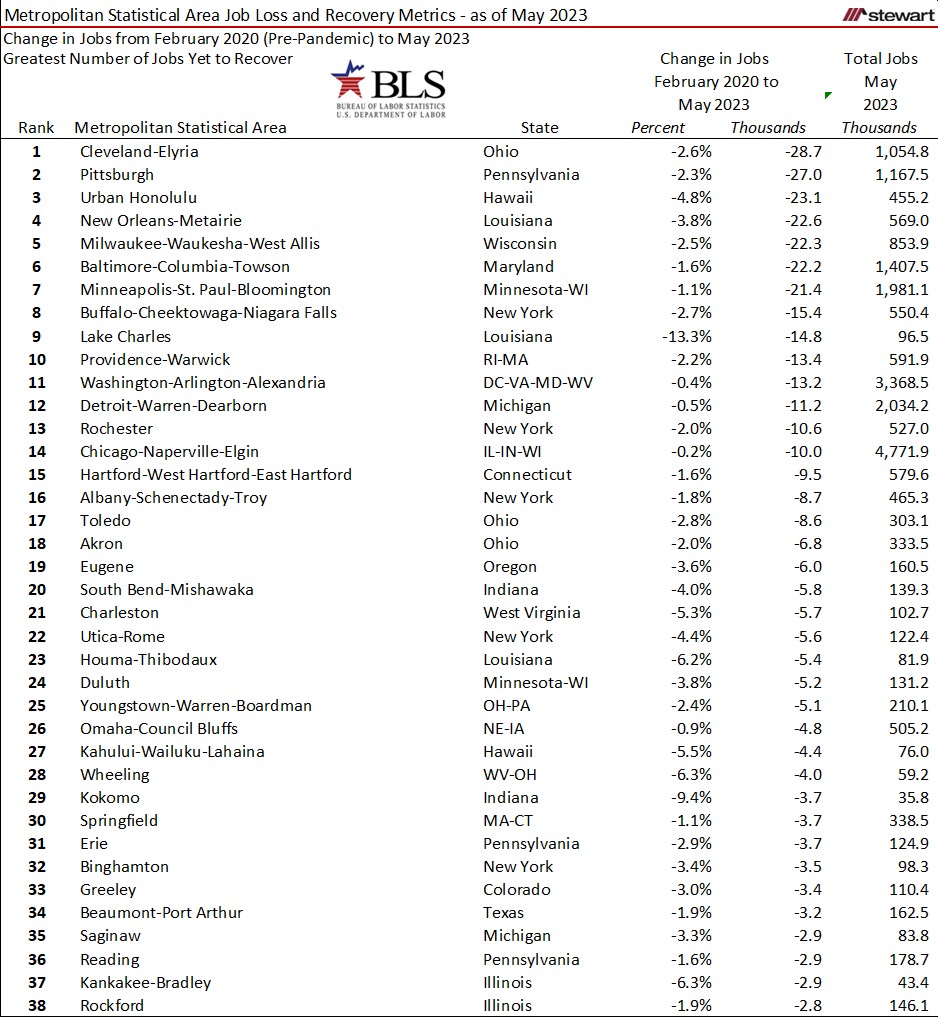
MSAs with the greatest number of jobs lost from February (pre-COVID) to the trough in 2020 (month varies across the MSAs) and yet-to-be-recovered are listed in the next table. The Cleveland-Elyria MSA was 28,700 jobs short in May 2023 compared to the number posted in February 2020.
The 38 MSAs with the largest gain in total employment numbers are detailed in the table. Seven MSAs added more than 100,000 net added jobs from February 2020 to May 2023 – very impressive.

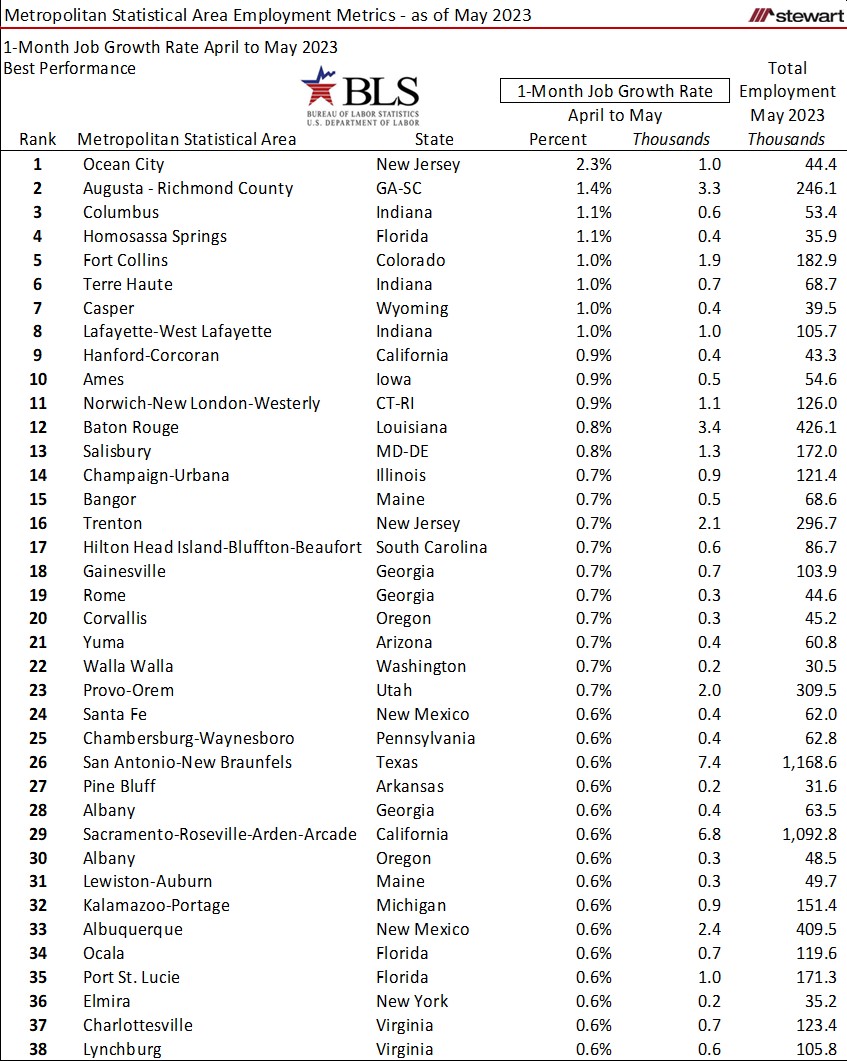
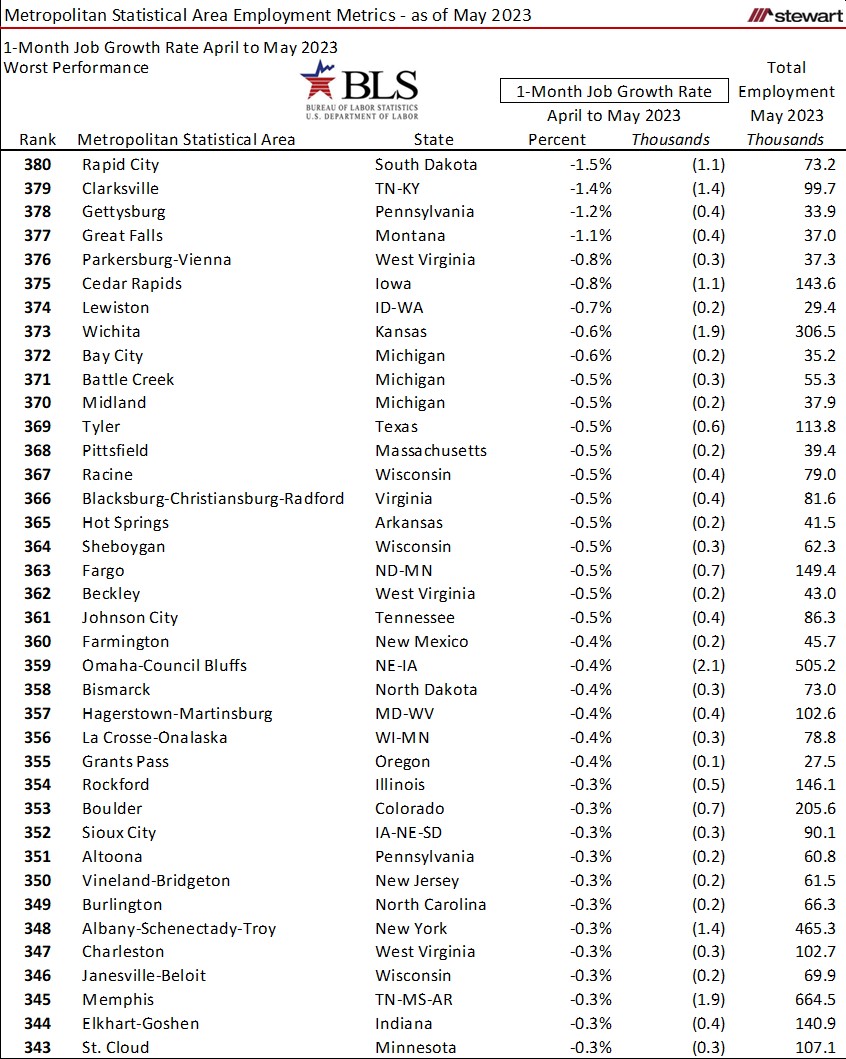
The latest top- and bottom 10 percent of all MSAs for 1-month job growth are included in the next two tables. Eight MSAs posted major job gains of at least 1 percent from April to May 2023, with Ocean City, New Jersey, up a massive 2.3 percent. Among the weakest 1-month performers, four MSAs shed at least 1.1 percent of the total number of jobs from April to May 2023: Rapid City, South Dakota (-1.5%), Clarksville, Tennessee-Kentucky (-1.4%), Gettysburg, Pennsylvania (-1.2%), and Great Falls, Montana (-1.1 percent).
Best and worst 10-year job gains and losses are detailed in the next two tables. Also included are 1-year and 5-year changes in the total number of jobs.


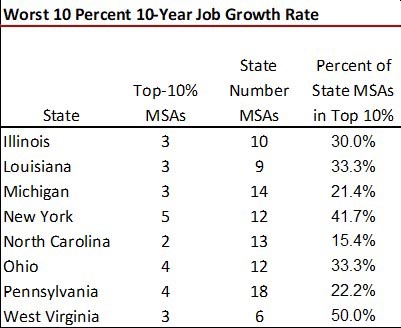
The appropriate comparison in the best and worst performing 10-year job growth level is not just the number of MSAs included in the rankings per state, but the percentage of MSAs per state in that subset. Within the top 10 percent of MSAs for 10-year job growth, the winner is no doubt Utah, which has all five of the state’s MSAs among the top gainers. Idaho was second best with an 80 percent inclusion and Florida once again had one-half of the state’s MSAs in the list. West Virginia and New York had the greatest percentage of state MSAs included in the bottom 10 percent.

The attached PDF includes these job metrics for all 380 MSAs as of May 2023, sorted by State and MSA:
Pre-COVID to date (February 2020 to May 2023) percentage change
1-month percentage change
1-year percentage change
5-year percentage change
10-year percentage change
Total number of jobs as of May 2023
Changes in local economies and job trends are widespread for an array of reasons. There have been winners and losers since the commencement of the pandemic, but no single factor explains why. And for many metrics, the pandemic accelerated already existing trends.
Ted