
Real Estate Cycles Across the U.S. and 54 Metros
5 Property Types - Q1 2023 Dr Glenn Mueller

Rising loan and cap rates commencing in Q4 2022 and continuing are eroding commercial real estate sales and values across the country, with total U.S. commercial real estate transaction volume in Q1 2023 the lowest posted in 11 years according to MCSI (RCA) data. The plunge in sales varies across property types and markets, however. One-size does not fit all when talking about commercial real estate.
Dr Glenn Mueller’s quarterly Commercial Real Estate Cycles report gives an oversite on what is going on in commercial real estate across the country with specifics for 54 metros for _Apartments, Industrial, Office, Retail and Hotel_ properties. Dr. Mueller defines four distinct phases in the commercial real estate cycle providing decision points for investment and exit strategies. Long-term occupancy average is the key determinant of rental growth rates and ultimately property values. Ideally, Phase 2 - Expansion is the ideal quadrant for real estate investor performance as shown in the following two graphs and discussion. Most graphs in this summary are taken directly from Dr Mueller’s Q1 2023 report.
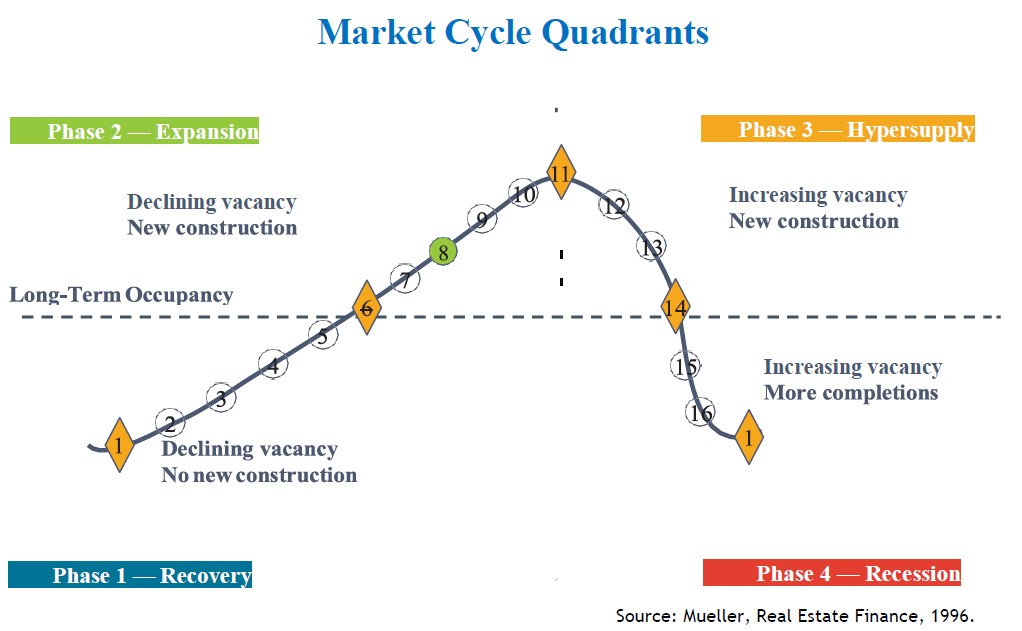
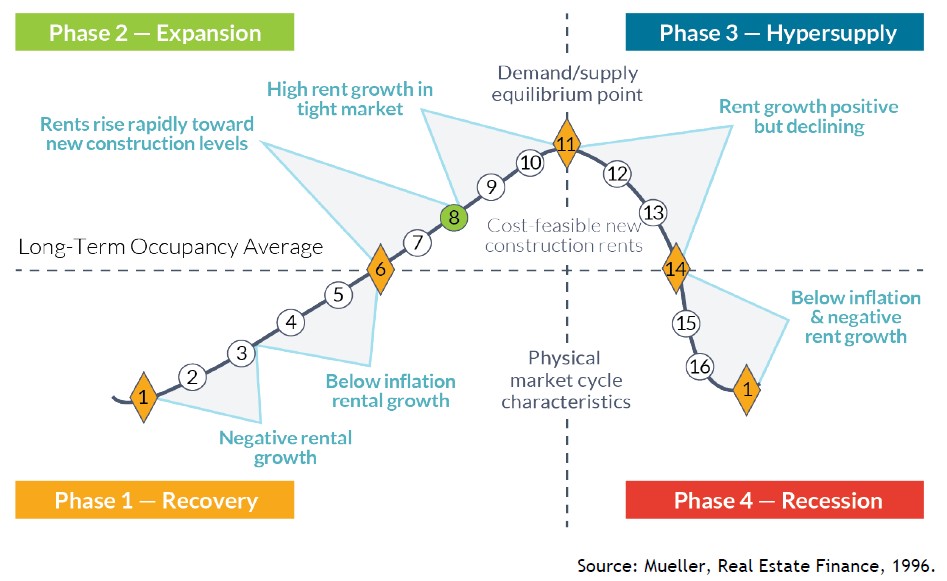
Across the cycle, Dr. Mueller describes rental behavior within each of the phases, using Market Levels ranging from 1 to 16. Equilibrium occurs at Market Level 11 in which demand growth equals supply growth – literally the sweet spot. The equilibrium Market Level 11 is also the peak occupancy level.
Phase 1 - Recovery Declining Vacancy, No New Construction
1-3 Negative Rental Growth
4-6 Below Inflation Rental Growth
Phase 2 - Expansion Declining Vacancy, New Construction
6-8 Rents Rise Rapidly Toward New Construction Levels
8-11 High Rent Growth in Tight Market
Phase 3 - Hypersupply Increasing Vacancy, New Construction
11-14 Rent Growth Positive But Declining
Phase 4 - Recession Increasing Vacancy, More Completions
14-16, then back to 1 Below Inflation, Negative Rent Growth
Rent Growth across the cycle is characterized as follows:
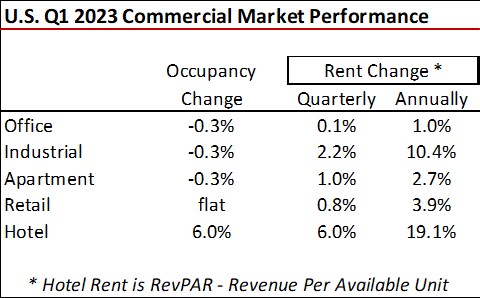
Rents and occupancy changes for Q1 2023, as reported by Mueller, are detailed for the U.S. in aggregate in the following table. Hotels posted the largest annual rent gain up 19.1 percent year-over year. Recall, however, the massive fall in in hotels at the onset of the pandemic.
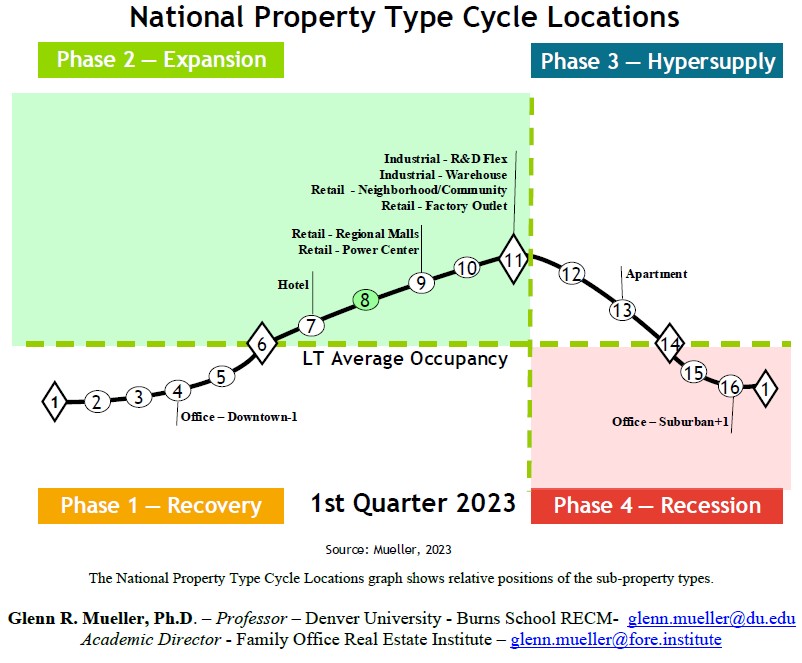
Dr. Mueller’s Q1 2023 report shows the current cycle stage from a national perspective across property types _. Industrial (R&D Flex & Industrial), Retail (Neighborhood/Community, Factory Outlet, Regional Malls & Power Centers)_ and _Hotel_ property types were in Phase 2 – Expansion in Q1 for the U.S. Property types at the peak performance Market Level 11 included: _Industrial R&D – Flex, Industrial – Warehouse, Retail – Neighborhood/Community_ (think grocery stores), and _Retail – Factory Outlet_. _Offices – Downtown_ were relegated to Phase 1 – Recovery. _Apartments_ were in Phase – 3 Hypersupply and _Office Suburban_ was classified in Phase 4 – Recession.
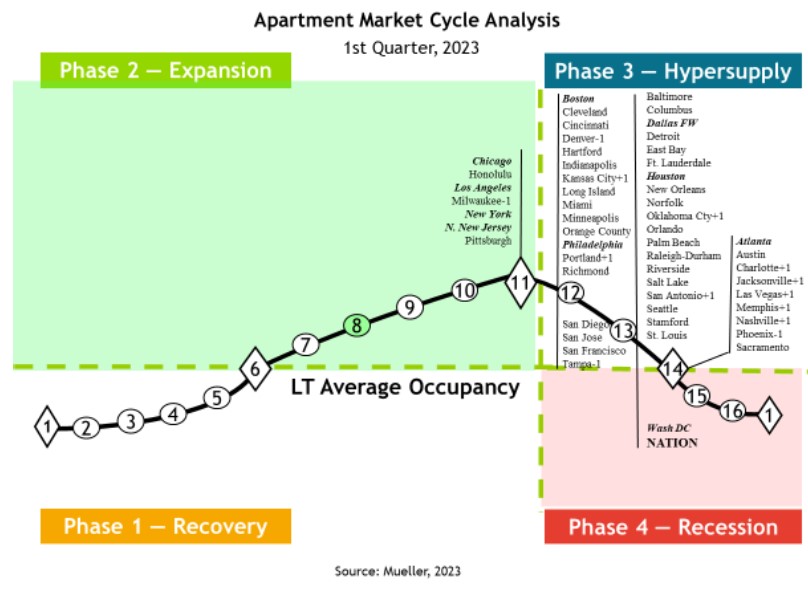
The summary for _Apartment_ properties for Q1 2023 is shown in the next table for 54 individual Metros across the country. [Download the report for all other property types – link is below.] Only seven metros remained at the optimum Market Level 11 as of Q1 2023:
Chicago
Honolulu
Los Angeles
Milwaukee
New York
North New Jersey
Pittsburgh
Nine metros _Apartment_ markets were at Market Level 14, Phase 4 Recession, characterized with increasing vacancy rates but with still more new construction deliveries in the pipeline:
Atlanta
Austin
Charlotte
Jacksonville
Las Vegas
Memphis
Nashville
Phoenix
Sacramento
All the remaining metros and the country are now in Phase 3 – Hypersupply with Increasing Vacancy Rates but still new construction commencing.
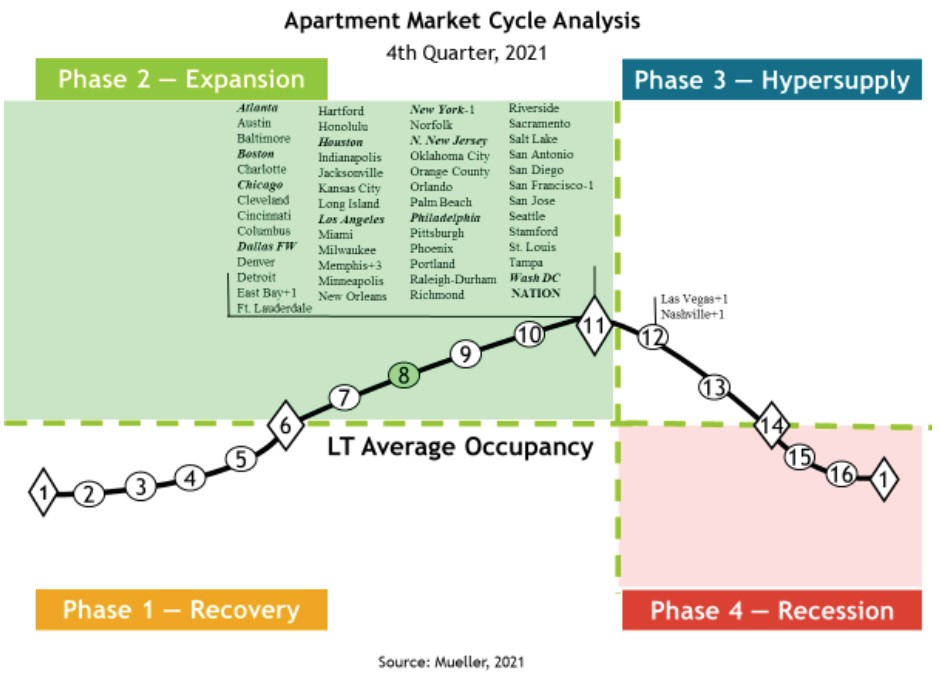
What is amazing is how quickly the _Apartment_ market eroded from the best possible situation (Market Level 11) as of Q4 2021 as shown below, with just two metros in Phase 3 – Hypersupply at that time: Las Vegas and Nashville.
Pay attention to each of the property types in the report focusing on cities that have excess supply, and also those with supply trailing demand.
For the Q1 2023 report click
To download current and historical quarterly reports click daniels.du.edu/burns-school and scroll down to the REAL ESTATE MARKET CYCLE REPORT section on the Website.
To learn more about Dr Glenn Mueller click daniels.du.edu/directory/glenn-mueller
For commercial real estate practitioners, Dr Mueller’s report is essential reading quarterly. Again, thanks to Glenn for exceptional cutting-edge commercial research. This is one of the best, data-dense analyses on commercial real estate across the U.S.
Ted