
U.S. Home Price Outlook - Listings Price Trends in 50 Largest Metros - NerdWallet

A core question today is what are home prices and values going to do in 2023? The National Association of Realtors® (NAR) latest forecast calls for sales to drop another 6.8 percent in 2023, but they expect the annual median home price to rise a minimal 0.3 percent. Fannie Mae sees home sales dropping 21.1 percent and prices receding 1.5 percent while the MBA calls for a 12.6 percent drop in sales and a 3.4 percent decline in prices. Redfin says median prices will be down 4 percent. FitchRatings is forecasting prices drop from 10 to 15 percent and Zonda says down 15 percent. NerdWallet said John Burns Real Estate Consulting sees a 20 to 22 percent drop from the highs posted in early 2022 but that Realtor.com expects a 5.4 percent price gain. Yes, that is a large range of opinions.
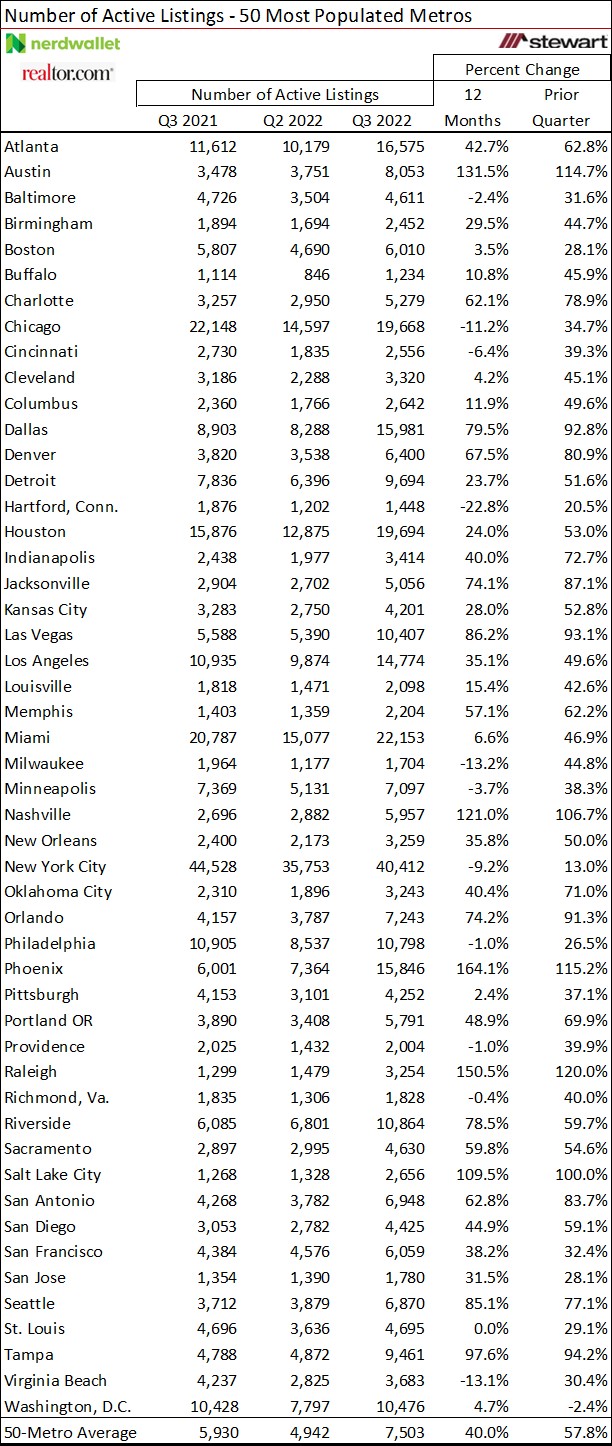
Among the latest studies on the topic and underlying metrics was a review of home listing prices by NerdWallet. They examined www.realtor.com data comparing average listing prices for Q3 2021 and Q2 2022 to Q3 2022 across the 50-largest metros in the U.S. To get an apples-to-apples comparison, they adjusted all values to September 2022 dollars using Consumer Price Index data from the U.S. Census Bureau. Their findings are detailed in the first table. On average across these 50 markets, listing prices rose 2.2 percent in the 12 months ending Q3 2022 but were down 2.3 percent sequentially from Q2 to Q3 2022, inflation adjusted.
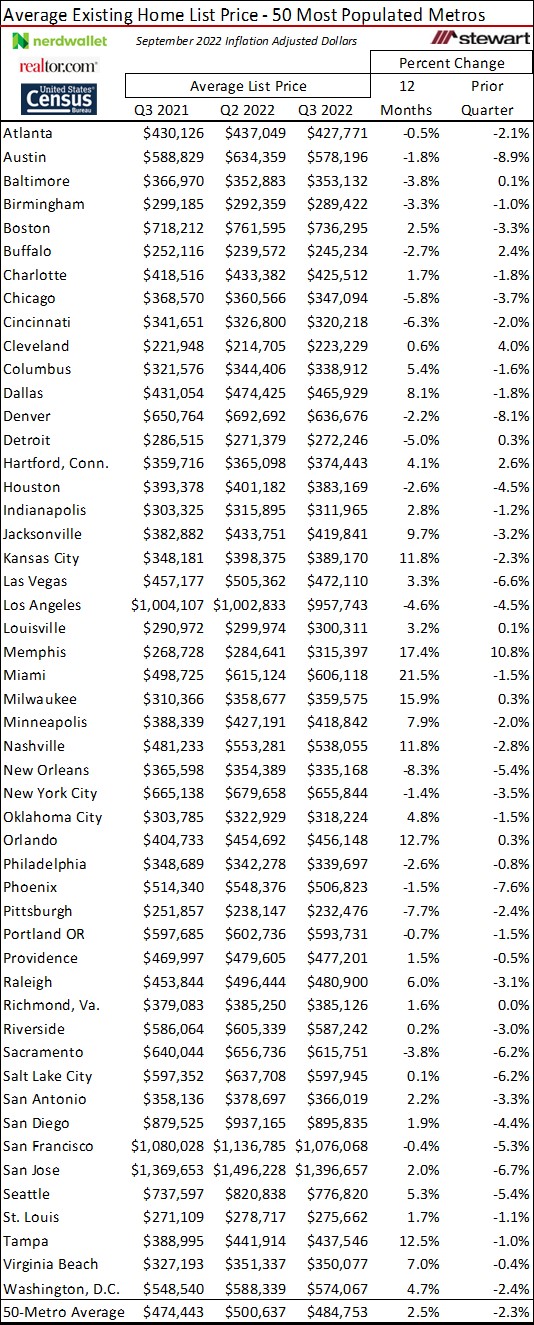
The TINSTAANREM axiom is applicable — There Is No Such Thing As A National Real Estate Market or economy. The same is true with respect to changes in listing prices, sales prices and volumes. Every economy is different.
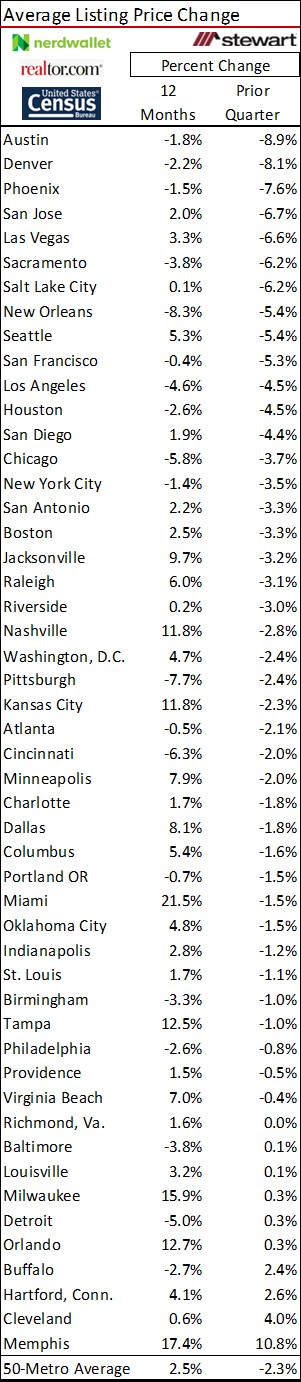
The next table is sorted from largest to smallest drop in listing prices from Q2 to Q3 2022. What were among the hottest markets in recent years now show some of the largest dips in asking price. Austin and Utah both saw declines greater than 8 percent in asking price from Q2 to Q3 2022.
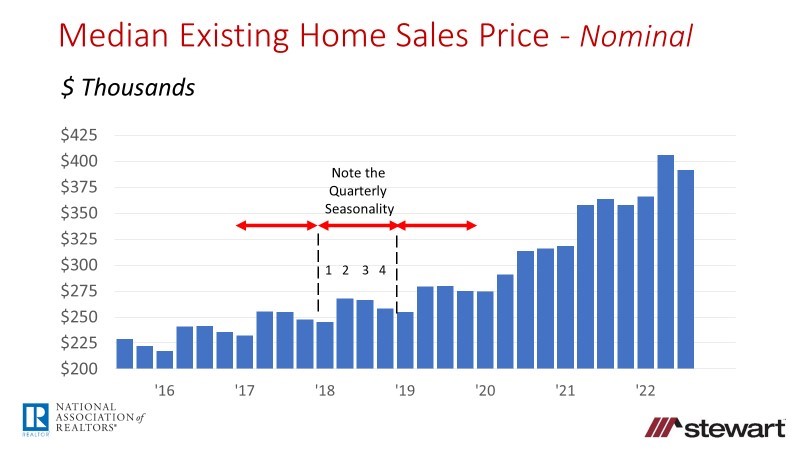
Prior to concluding that home values have changed from Q2 to Q3 2022, the seasonality of home prices needs consideration. As the following graph shows, prices vary from one quarter to the next. Typically Q1 is the lowest both in number of sales and prices, Q2 is the annual peak, Q3 is down ever so slightly from Q2 and Q4 drops as the number of sales shrinks – at least prior to the pandemic. These are nominal prices, i.e., not adjusted for inflation. This implies that real list prices (inflation adjusted) were down 1.9 percent in Q3 2022 compared to Q2 2022 (a 2.3 percent drop in asking price minus the 0.4 percent seasonal price adjustment). The decline in sales price was greater than this when considering the drop in bidding wars on home listings. In Q2 2022, Redfin reported that 56 percent of their offers had competitive bids compared to 44 percent in Q3.
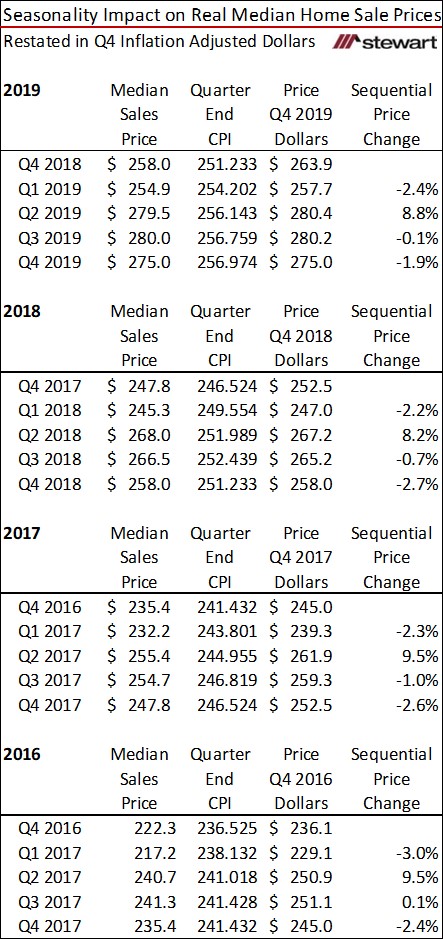
The next table restates quarterly median prices (as reported by NAR) from 2016 through 2019 and extracts seasonality changes from one quarter to the next. In this four-year period (after adjusting for inflation), Q1 prices were on average 2.5 percent less than the preceding Q4, Q2 prices (the annual peak) were up 9.0 percent when compared to Q1, Q3 was down just 0.4 percent on average from Q2 and Q4 was down 2.4 percent vs. Q3.
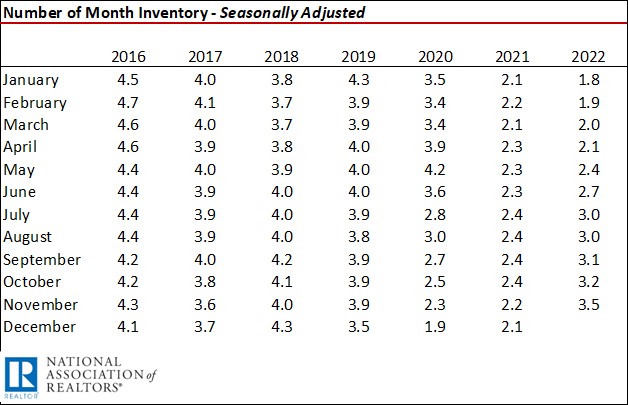
Sales prices are a function of the interaction of supply and demand. If demand shrinks and supply increases enough, prices will decline. NAR reported November 2022 sales were off 35 percent compared to one year ago (using raw, unadjusted sales data) and also seasonally adjusted annualized sales. At the same time, the number of months of inventory has risen to the highest level seen in 29 months as reported by NAR as shown in the table.
The NerdWallet study also shows a rising inventory of listings in the 50 most populous metros in the latest quarter, up an average 57.8 percent as detailed in the table. Several metros—Austin, Nashville, Phoenix, Raleigh, and Salt Lake City—saw a more than doubling of inventory available for sale from Q2 2022 to Q3.
Home prices continue to outrun incomes which negatively impacts affordability and further reduces sales. In the early 1980s it was considered best if the home price was four or less times that of the homeowner’s income. The latest income-to-home-price multiples and average for the 50 largest metros are detailed in the table. The average home price multiple in this group is 5.7 times typical income. Compounding that has been rising interest rates. The latest 30-year fixed-rate conventional mortgage loan averaged 6.42 percent (as reported by Freddie Mac December 29, 2022) — more than double the 3.11 percent reported one year ago. At a constant 20 percent down assumption and a flat inflation-adjusted home price, the monthly principal and interest payment jumped from $1,267.98 (for a $370,700 median-priced home in November as reported by NAR) to $1,858.89 – an increase of 46.6 percent. In the latest 12 months, average hourly wages rose just 5.1 percent according to the U.S. Bureau of Labor Statistics. Monthly mortgage payments have risen nine times more than incomes in the past 12 months.
Latest Recession Expectations Summary
Fannie Mae – modest recession will commence in Q1 2022
Bloomberg – probability of a recession is now 100 percent within a year
PIMCO – recession more likely than not but mild
JPMorgan – mild recession in 2023
Forbes – recession will begin late 2022 or early 2023
S&P Global – mild recession early next year with recovery in the 2nd half of 2023
Former Boston Fed President Eric Rosengren – U.S. likely headed to mild recession in 2023
FitchRatings – recession to start in Q2 2023
University of Michigan Economists – mild recession ahead in 2023
World Bank – risk of global recession in 2023
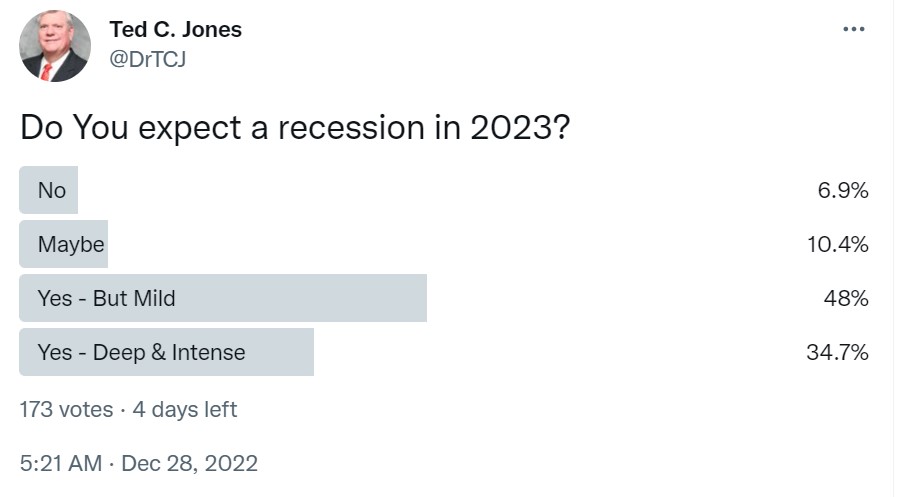
Ted C Jones Online Twitter Poll
Click here to read the full NerdWallet article.
Click here for median existing home prices from NAR.
The Bottomline
With a 35 percent drop in existing home sales (demand) this November compared to one year ago, a 57.8 percent increase in listings available for sale (supply) from Q2 to Q3 2022, rising interest rates (that doubled in the past 12 months) and a high potential of a recession in 2023, expect home values to drop in 2023 – perhaps as much as 10 to 14 percent. Though each individual market will vary, overall prices will decline, I believe. That said, the drop will be nothing like 2008 to 2010 as so much equity exists among most homeowners today and loan quality is the best in history. Good news is that the majority of homeowners today have significant equity and interest rates of 5 percent or less. Those that recently purchased or those looking to purchase a home today, however, may be at risk.
Ted