
The Ugly Trifecta Facing Homebuilders -- May 2021 New Home Sales
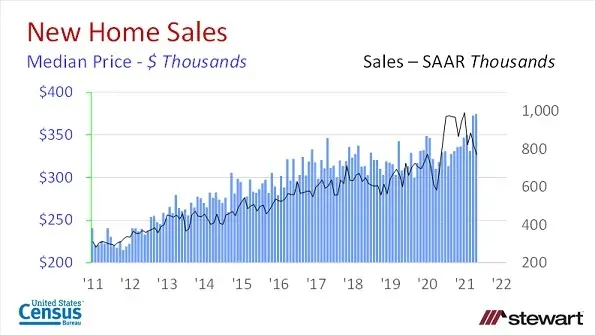
Homebuilders face a trifecta of impediments – _not winnings_ – with new home construction being hindered by shortages of workers, materials (including appliances, fixtures, HVAC and even hot-water tanks) and developed residential building lots. As a result, May new home sales slid for the second month in a row sequentially from the prior month using the seasonally adjusted annualized rate (SAAR) of sales. New home sales were down 5.9 percent in May 2021 to 769,000 from a revised 817,000 in April. April 2021 was down 7.8 percent from March’s 886,000 new home sales. Though May 2021 sales were up 9.2 percent vs the same month in the prior year, recall that the pandemic significantly stunted existing home sales in April, May and June of 2020.
New home sales and respective median prices are shown in the following graph. Though sales have stuttered in the past two months, new home median prices set all-time records each of those months.
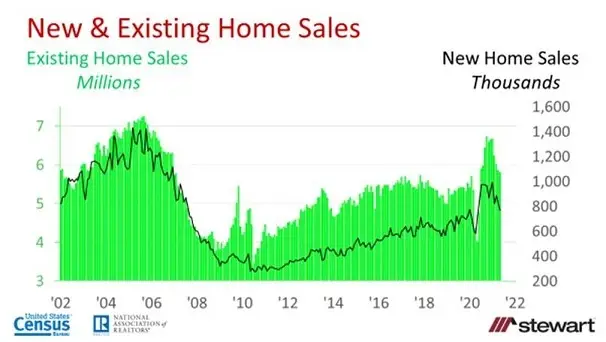
New and existing home sales on a SAAR basis are shown in the next graph commencing in 2002. The scale for existing home sales is millions (read on the left axis) while new home sales are stated in thousands (on the right axis). New home sales are reported differently, however, than existing home sales. Existing home sales are actual closings with the transfer of ownership taking place whereas new home sales are tallied when a purchase contract is signed. As a result, typical is a large percentage of revisions each month in new home sales. Within the 769,000 new home sales reported in May 2021, 276,000 had not yet started construction (35.9 percent), 305,000 were under construction (39.7 percent) and 188,000 were completed (24.4 percent).
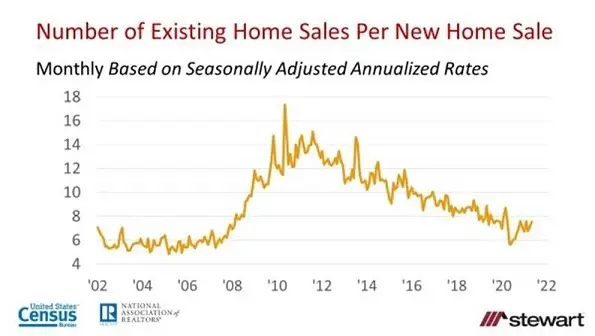
The ratio of new and existing home sales each month (both on a SAAR) are shown in the next graph. Since 2002, there has been an average 8.9 existing home sales per new home sale and a median 8.7.
New and existing home median prices are shown monthly in the next graph. Since 2001, new home median price was less than the existing home median in just one month – June 2005 with 1.5 percent premium in existing home transactions.
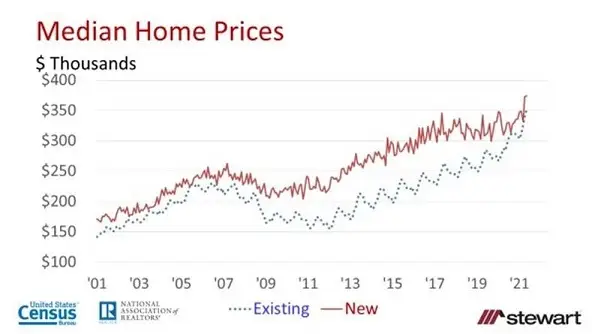
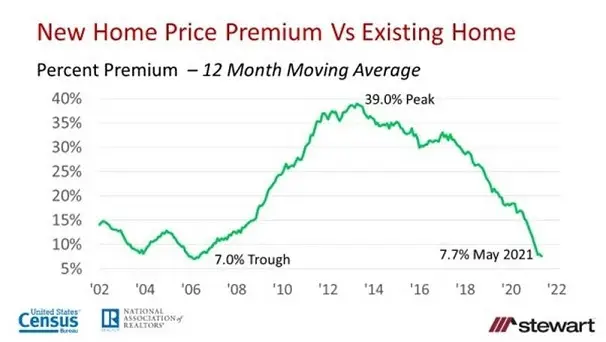
The premium paid for new homes vs existing homes in shown in the last graph using a 12-month moving average to remove seasonality and general noise in data from month-to-month. In the past 20-years the greatest new home premium of 39.0 percent was registered in April 2013 with the trough measured in March 2006 at 7.0 percent. May 2021 came in with a 7.7 percent new home median price premium average over the past 12-months.
As I stated in one of the Stewart blogs last week:
“Growth of new homes is constrained by low lot inventories, minimal skilled labor in roofing, framing, electrical and plumbing and supply-stream constrictions on materials – particularly in appliances and HVAC systems. While lumber costs remain highly elevated compared to April 2020, futures prices last week fell 43.8 percent from the high recorded in May of this year, but are still 200 percent greater than the $303.50 price per thousand board feet seen at the start of the pandemic in March 2020.”
Not yet included but on the horizon are rising interest rates – though there is no consensus on future interest rates between Fannie Mae and the MBA – see https://www.stewart.com/en/insights/2021/06/25/housing-market-residential-lending-forecast-summary-june-2021 It is my opinion that part of the reason for near record-low residential mortgage rates is that homebuyers today have the best credit scores in history as those that maintained employment paid down credit card balances, hit a record savings rate and had no place to spend the money given the pandemic. Just a decline in credit scores across homebuyers would cause reported interest rates to rise.
Still, take your builder out to lunch and pick up the tab given the ugly trifecta they currently face. They need a break.
Ted