
Median Single-Family Existing Home Prices Q3 2021 by MSA

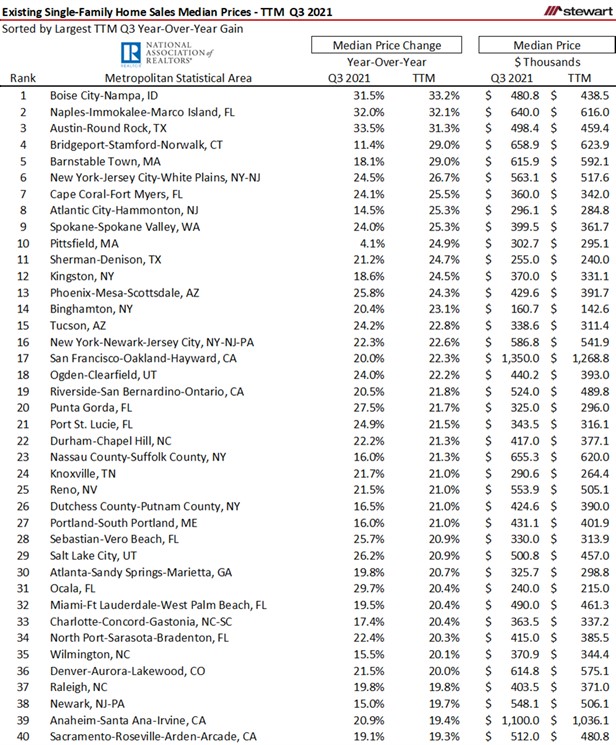
As the demand for housing expanded at the onset of the pandemic, housing prices in almost all markets soared, up a phenomenal 16 percent year-over-year on average in the U.S. for existing-single family homes as of Q3 2021 as reported by the National Association of Realtors® (NAR). NAR reports quarterly median prices for 183 Metropolitan Statistical Areas (MSAs). Median home prices were up double digits percentagewise year-over-year in eight-out-of-every 10 MSAs (78 percent) in Q3 2021.
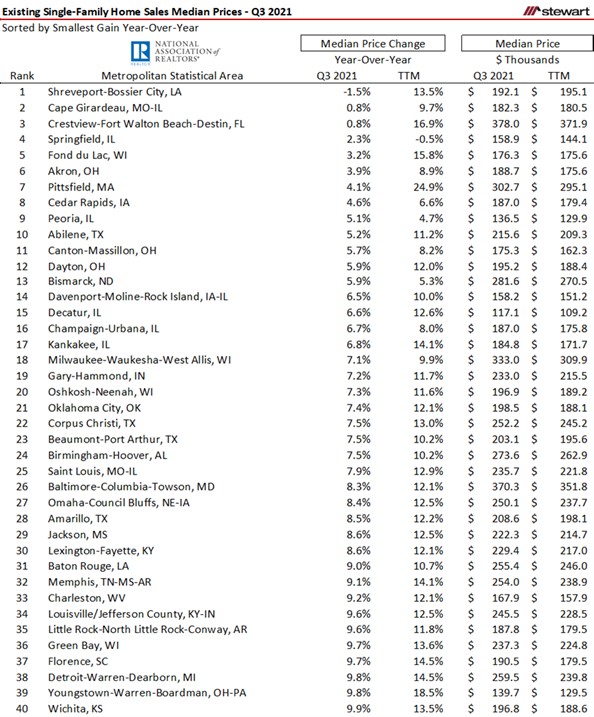
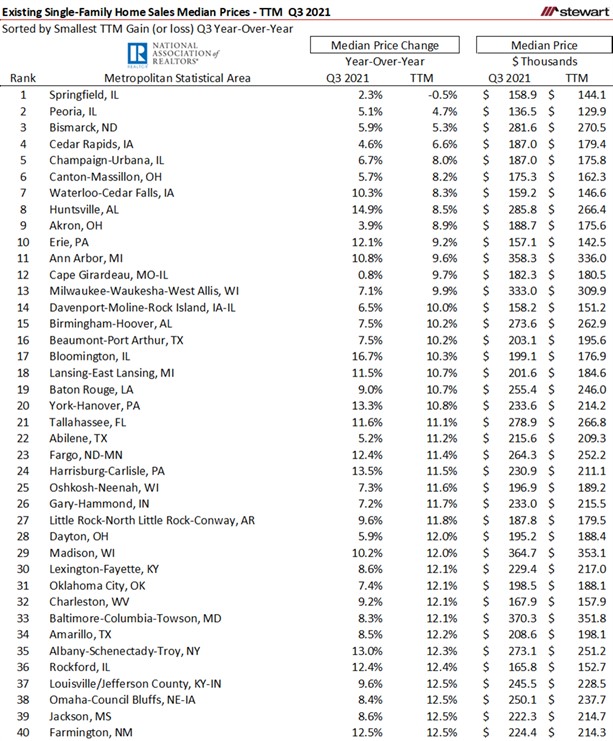
The first table shows the 40 MSAs with the largest year-over-year median price gains followed by the 40 with the smallest price gain. Also included is the median single family home price for the trailing-12 months (TTM) calculated by averaging median quarterly home prices from Q4 2020 through Q3 2021.
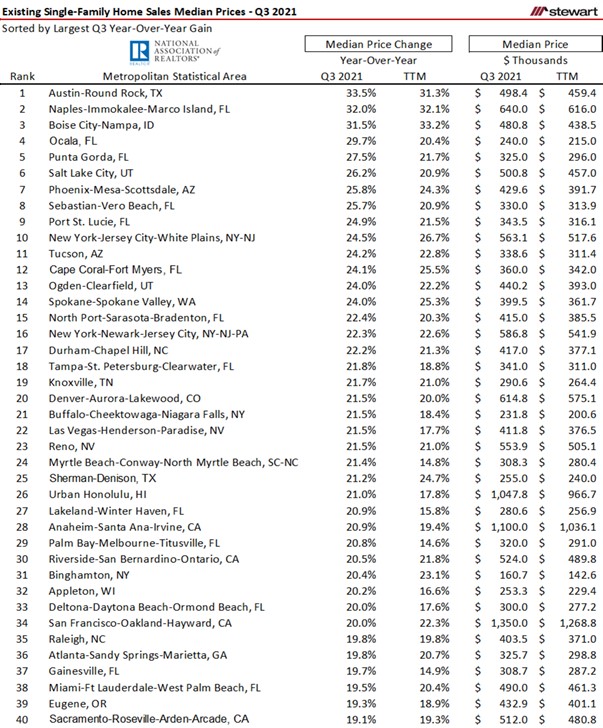
Only one MSA included in the NAR data showed a year-over-year decline in median home values – Shreveport-Bossier City, Louisiana, down just 1.5 percent. Two other MSAs posted year-over-year gains of less than 1 percent coming in at 0.8 percent – Cape Girardeau Missouri-Illinois and Crestview-Fort Walton Beach-Destin Florida. On a TTM basis, however, the two MSAs posted gains of 9.7 percent and 16.9 percent, respectively.
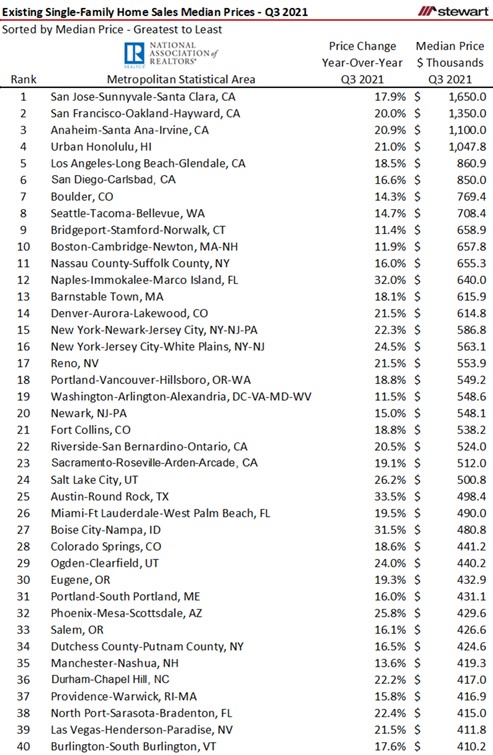
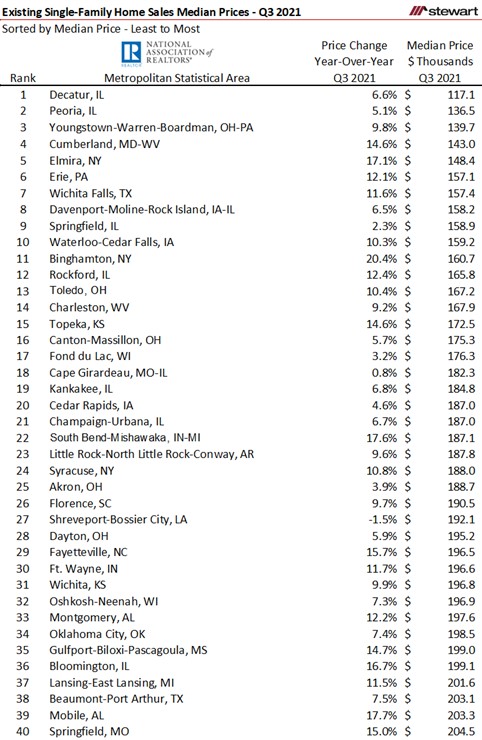
The next two tables sort MSAs from the least to most expensive as of Q3 2021. Five of the 10 most expensive housing MSAs are in California including the top-three.
The next two tables list the 40 MSAs with the smallest and largest changes in MSA home prices based on the trailing 12-months.
To answer the question of whether home prices on more expensive homes are appreciating at a faster rate or vice-versa, the Pearson Product Moment Correlation Coefficient was calculated for the each of the 40 least and most expensive MSAs. The correlation coefficient between price and median price was 0.0513 for the least expensive homes and -0.1018 for the mast expensive. Neither showed much correlation at all nor were either statistically significant.
To review the Q3 2021 MSA median price press release from NAR click https://www.nar.realtor/newsroom/home-prices-spiked-by-double-digits-in-78-of-metro-areas-in-third-quarter-of-2021
Tables with 183 MSAs are available at metro-home-prices-q3-2021-single-family-2021-11-10.pdf (nar.realtor)
Attached is a PDF listing Q3 2021 median home price by MSA, trailing 12-month Median price and percent changes year-over-year sorted for both metrics, alphabetically by MSA. Q3 Median Home Price by MSA.pdf
The outlook for where single family prices are heading is not in agreement, however. Fannie Mae is forecasting that single family median home prices will rise from $351,000 in 2021 to $391,000 in 2022 (up 11.4 percent) while the MBA sees a more muted gain of 3.1 percent rising from $344,600 to $355,300.
Unlike the housing bubble that burst in 2008, current home prices are up due to the classic interaction of limited supply and strong demand.
Ted