
April 2020 Jobs Report - Ugliest in Our Lives with More to Come
The April 2020 jobs report for the U.S. came in with a reported 20.5 million lost jobs in the month and unemployment hitting 14.7 percent, the highest seen since the Great Depression. Both these statistics, however, are likely understated and incorrect due to methodology.
The Bureau of Labor Statistics (BLS) is the official keeper of employment data and uses two primary approaches to count jobs and track unemployment. The first is the Payroll Survey (the tool used to estimate total jobs) and the second the Household Survey (for estimating unemployment).
Payroll Survey Designed to estimate the number employed, hours worked, and earnings for nonfarm workers along with the type of job including industry and geographic details. The survey is based on monthly polling of 145,000 businesses and government organizations representing approximately 697,000 workers. The establishments are asked to report employment for the pay period that includes the 12th of the month – hence the miss in actual employment changes for those workers with more than one paycheck each month. An estimated one-third is businesses have a weekly pay period, 40 percent biweekly, 20 percent semimonthly, and a small amount monthly. This is also known as the Establishment Survey.
Household Survey Purpose is to estimate the total labor force, employment, and unemployment rates, and other metrics along with demographic details. A monthly survey of approximately 60,000 either in-person or by the telephone is the foundation for this tool. No in-person interviews were completed in the past two months due to the virus. Individuals were counted as being Employed, Unemployed, or Not in the Labor Force. In the past month, the response rate for the household survey was around 70 percent, 13 percent less than the pre-virus norm.
To read more on the methodology of these two tools click https://www.bls.gov/web/empsit/ces_cps_trends.htm#intro
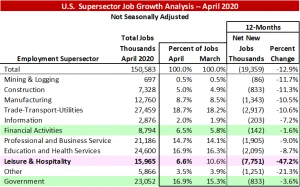
The essence of the jobs report is shown in the following table which details the changes in employment by SuperSector. These data are not seasonally adjusted, however, so these are best monthly estimates of total jobs by employment sector. The best performing job sectors in April were Financial Activities and the Government, down just 1.6 percent and 3.6 percent, respectively, when compared to one year ago. The biggest loss was the massive 47.2 percent plunge in Leisure & Hospitality – literally laying off one-out-of-every two workers in the segment.
While the table shows that the total percentage of jobs employed in Government rose from 15.3 percent in March to 16.9 percent in April, the increase in percentage was a function of greater job declines in other sectors and not an increase in Government jobs. On a non-seasonally adjusted basis, Government jobs shrunk by 937,000 from March to April alone.
A general summary of the jobs within the NAIC index can be seen at https://www.bls.gov/iag/tgs/iag_index_naics.htm where more detailed subsector levels can be viewed by clicking.
To read the complete jobs report from the Bureau of Labor Statistics click https://www.bls.gov/news.release/pdf/empsit.pdf
Brace yourself for another difficult employment for release for May 2020 as unemployment applications continue to rachet up by millions each week. Some sectors, are less impacted than others, with Leisure and Hospitality shrinking the most. Good news, however, is the reopening of businesses now taking place across the country. The tough news is that millions of workers on furlough may yet permanently lose their jobs when the Paycheck Protection Program (PPP) expires.
Ted