
U.S. Supersector Employment Changes from 1950 to 2020
As an economist, every time I drive through or fly into a new town or city I wander what the people there do to earn a living. That’s why my most frequently used term and descriptor of the economy is, “Jobs are everything. Period. It’s all about jobs.”
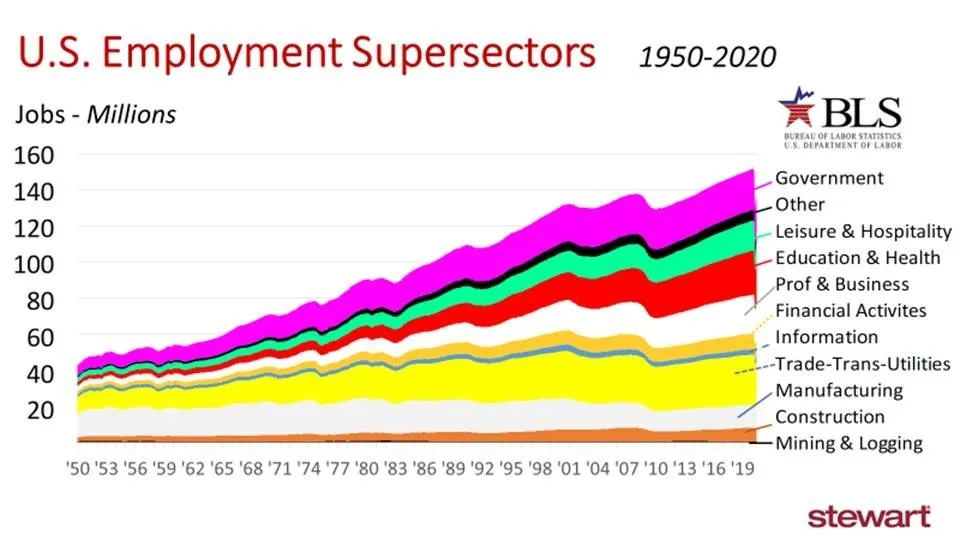
The numbers and types of jobs Americans do have changed in the past 70 years. Total number of jobs in the U.S. rose from 43.5 million in January 1950, to a peak of 152.5 million in February 2020 prior to the Coronavirus Pandemic. Just as the total numbers have changes, so have the types of jobs.
To identify what has changed and what has stayed the same, seasonally adjusted Supersector employment data from the U.S. Bureau of Labor Statistics (BLS) were analyzed. Supersectors are a general categorization of job types. This is a segment of the North American Industry Classification System (NAICS), which “…..is the standard used by Federal statistical agencies in classifying business establishments for the purpose of collecting, analyzing, and publishing statistical data related to the U.S. business economy.”
The graph shows Supersector jobs monthly commencing January 1950. As shown visually, some of the Supersectors have grown at a greater pace than the U.S., some stayed the same and others shrunk. The Mining & Logging Sector (which includes oil and gas exploration, development and production) is positioned at the bottom of the graph along the X axis, but is not visible since total employment is just 0.5 percent.
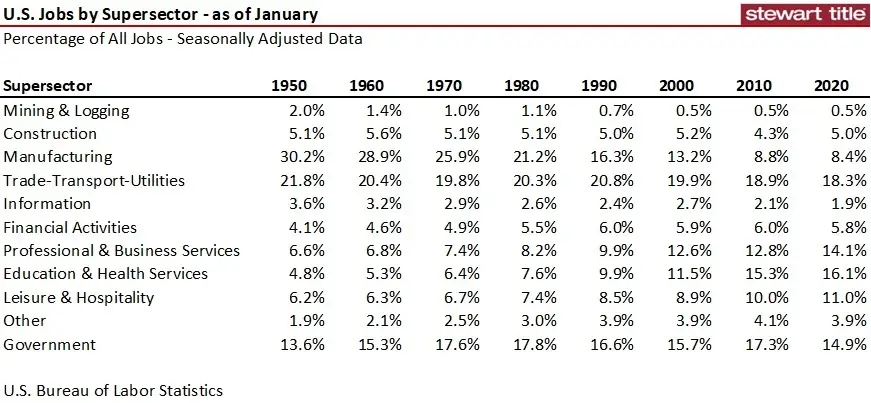
The following table shows the percentage of all jobs as of January for each of the stated years using seasonally adjusted data. In January 1950, for example, three out of 10 jobs in the country (30.2 percent) were in Manufacturing. That fell to one-out-of-every 12 jobs by January 2020 (8.4 percent).
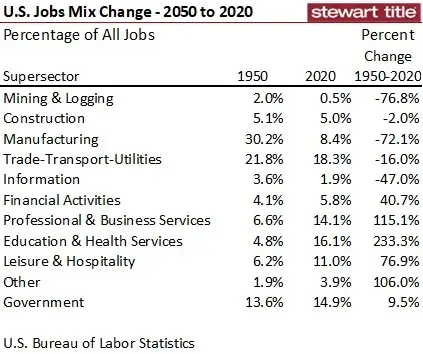
The next table shows the percentage of jobs in each Supersector in January 1950 and 2020. Sectors that shed the largest percentage of jobs in the workforce were the Mining & Logging Sector and Manufacturing. In 1950, Mining & Logging made up 1 out of ever 50 jobs, falling to just 1-out-of-every 200 in 2020. Education & Health Services posted the largest gain, growing from 4.8 percent of all jobs in 1950 to 16.1 percent in 2020.
Evolution in technology also speeds change in the types and numbers of jobs. An example of change is the Oil & Gas subsector of the Mining & Logging Supersector. The next graph shows West Texas Intermediate Crude Oil prices monthly commencing 2007. Oil bobbled along around $100 per barrel from 2010 to 2014, and then fell by half to the $50 level from 2016 through 2019.

Average daily production, however, rose from 8.9 million barrels per day in 2015 to 12.2 million barrels daily in 2019. Even though prices halved and average daily production jumped 38 percent, the total number of oil field workers in production and support dropped 20 percent.

For further details and descriptions of job classifications under the NAICS and to view the 600+ page description of the system click https://www2.census.gov/library/reference/naics/publications/2017-NAICS-Manual.pdf
Change will continue to evolve. My expectation post-pandemic is for manufacturing jobs to increase as a percentage of total employment as more jobs are brought back to the U.S. Manufacturing jobs returning from China will be those considered essential or critical to national security such as pharmaceuticals. An analysis by the Department of Commerce found that 97 percent of all antibiotics in the U.S. are manufactured in China. An estimated 80 percent of the Active Pharmaceutical Ingredients (API) are made in China. I doubt that remains given the essential nature of these and other products. I am also concerned that businesses will have a behavior similar to that in the oil sector discussed above. The longer this downturn continues, the more changes that businesses will incorporate as an element of survival.
Still, jobs are everything to the economy and the demand for real estate. Period.
Ted