
October Job Growth Revs Up Like an Engine on Fresh, High-Octane Fuel
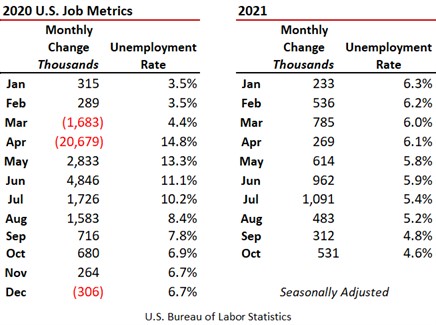
Job growth, after sputtering in September like an engine with water in the gas tank, roared back in October 2021 adding 531,000 net new jobs on a seasonally adjusted basis as reported by the U.S. Bureau of Labor Statistics (BLS). This was far better than the 450,000 consensus forecast among economists surveyed by the _Wall Street Journal_. The unemployment rate shrunk from 4.8 percent in September 2021 to 4.6 percent in October and was down from 6.9 percent one year ago. The Federal Reserve considered an unemployment rate from 5.0 percent to 5.5 percent as the tipping point defining full-employment prior to the pandemic. The following table shows monthly change in jobs and the corresponding unemployment rate monthly since January 2020.
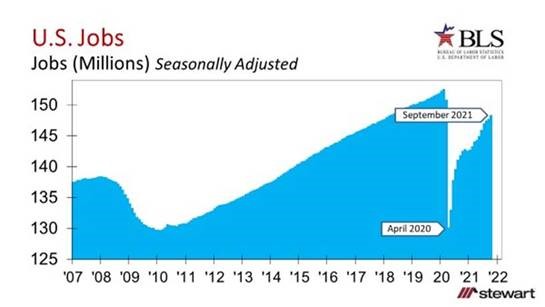
Total jobs are shown monthly in the graph commencing in 2007 – prior to the Great Recession. The U.S. has now brought back 81.2 percent of the 22.4 million jobs lost at the onset of the pandemic numerically speaking.
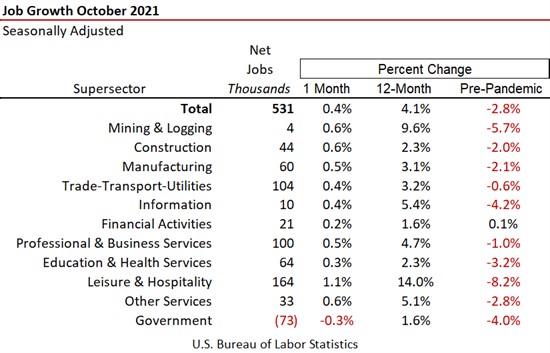
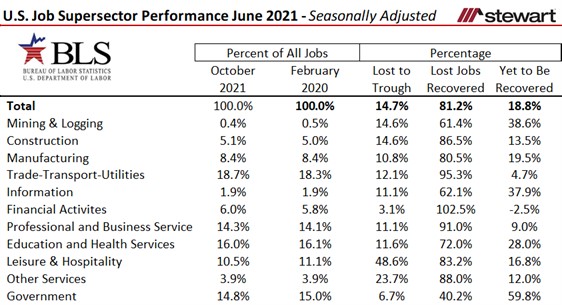
Not all job sectors were impacted equally by the pandemic nor are they recovering similarly. Monthly job gains as of October 2021 for each of the Super Sectors (as defined by the BLS) are shown in the table. Also included is the percentage change from the prior month, year-over-year and prior to the pandemic – February 2020.
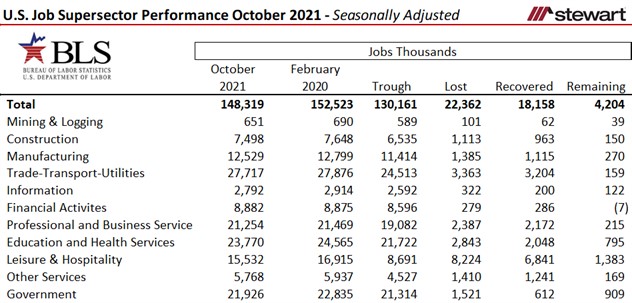
These data are further detailed in the next two tables. The first breaks out the number of jobs by thousands and the second comparative percentages. Financial Activities is the only sector that has more jobs today than in February 2020 – the month prior to the pandemic.
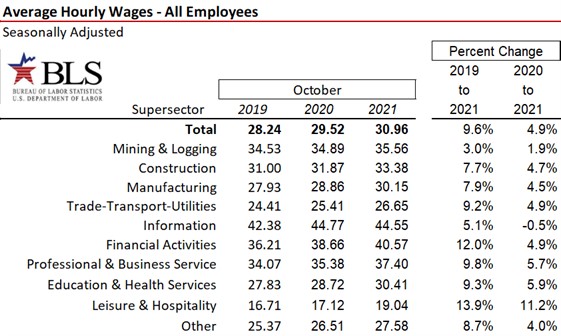
Hourly wage rates were up across all Super Sectors on a year-over-year basis except Information (down 0.5 percent) as shown in the next table. The greatest gain for both 12- and 24-month periods was Leisure & Hospitality, up 13.9 percent and 11.2 percent, respectively.
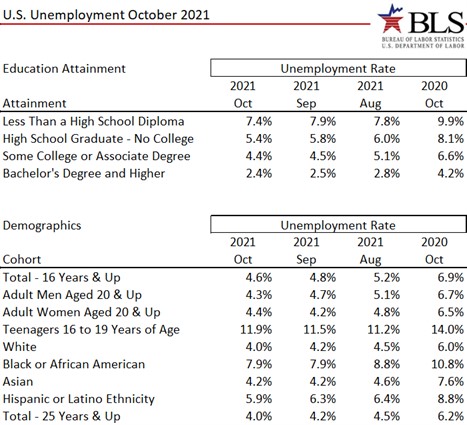
Unemployment rates are detailed across Educational Attainment and Demographic Cohorts in the next table. Those with a Bachelor’s Degree had an unemployment rate approximately one-third those with less than a High School Diploma at 2.4 percent and 7.4 percent, respectively.
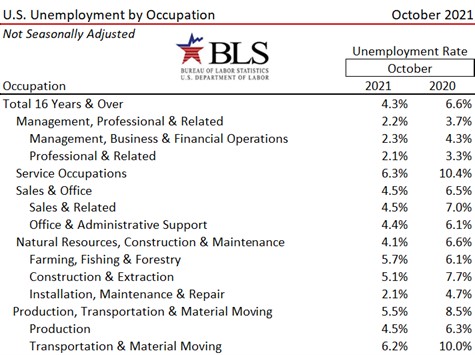
Unemployment rates for Occupation and by Industry & Worker Class are detailed in the next two tables. These data are only reported on an unadjusted basis (not-seasonally adjusted) so can only be compared year-over-year on an apples-to-apples basis.

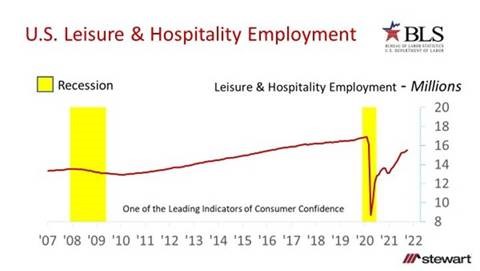
The hardest-hit Super Sector -- from the number of jobs perspective -- remains Leisure and Hospitality. After losing one-half of all jobs in March and April 2020, the sector has come back as in the graph.
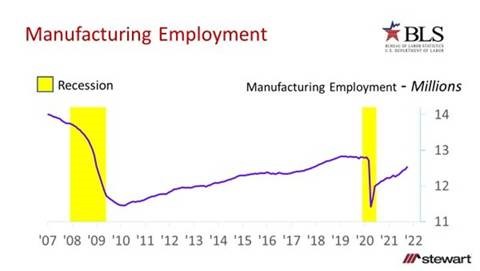
The Manufacturing sector received considerable attention by the press in the October jobs release having added 60,000 jobs in October – double that of the prior month. However, just to return to the number of Manufacturing jobs as of January 2007 would take more than two years at a 60,000 monthly pace. The 60,000 was largest monthly Manufacturing job gain seen since August 1998 prior to the pandemic when there were 17.563 million jobs in the sector versus 12.529 million as of October 2021.
Jobs are everything to the economy. Period. While the October jobs report was welcome news, it may be years until all of the Super Sectors return to pre-pandemic employment numbers.