
Existing Home Sales Lose Traction in February 2022 But Prices Continue Upwards Climb - at Least for Now

Existing Home Sales February 2022 – National Association of Realtors® (NAR)
Box Score
As of February 2022
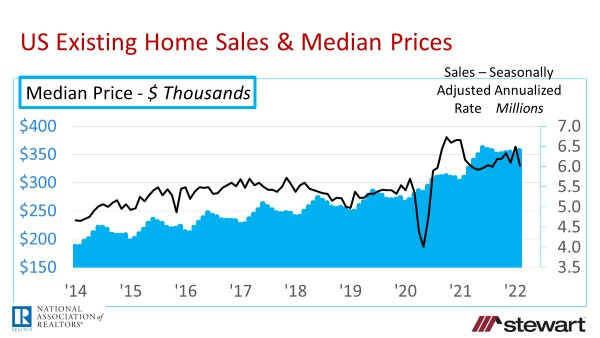
Seasonally Adjusted Annualized Sales Numbers (SAAR)
6.02 million SAAR as of February 2022
down 7.2 percent sequentially from January 2022 which tallied 6.49 million
down 2.4 percent year-over-year from 6.17 million in February 2021
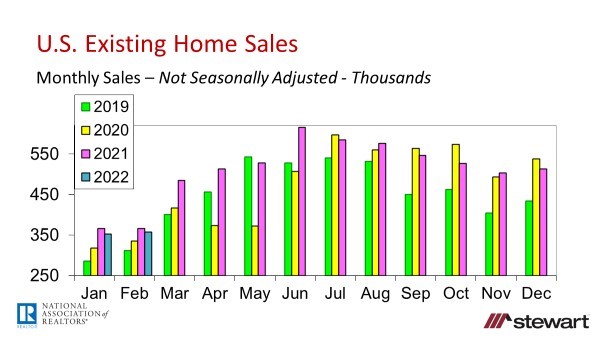
Monthly Sales _– raw data not seasonally adjusted_
357,000 for the month of February 2022
up 1.4 percent sequentially versus the 352,000 sales in January 2022
down 2.5 percent versus the 366,000 sales in February 2021
Sales Trailing 12-Months _– raw data not seasonally adjusted_
6.097 million for the 12-months ending February 2022 _– raw data not seasonally adjusted_ down 0.15 percent vs 12-months ending January 2022 of 6.106 million
up 6.5 percent vs 12-months ending February 2021 of 5.724 million
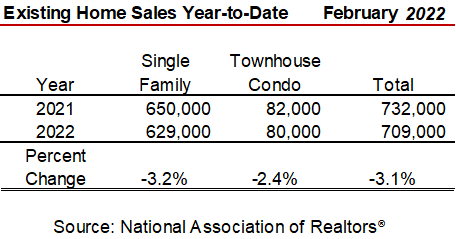
Sales Year-to-Date _– raw data not seasonally adjusted_
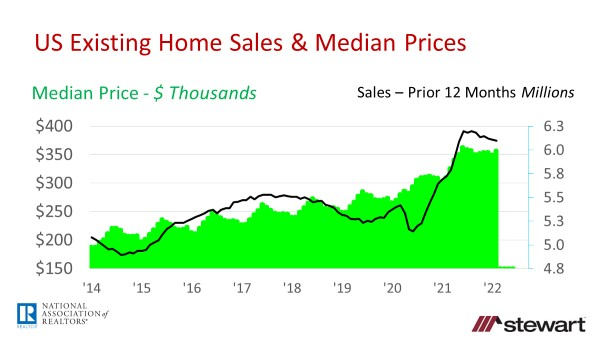
Median Price – February 2022 _due to historic monthly seasonality of existing home prices, only a year-over-year comparison is made_
$357,300 – _not seasonally adjusted_ up 15.0 percent vs $310,600 February 2021
Average Price – February 2022 _due to historic monthly seasonality of existing home prices, only a year-over-year comparison is made_
$370,700 – _not seasonally adjusted_ up 8.4 percent vs $342,100 recorded in February 2021
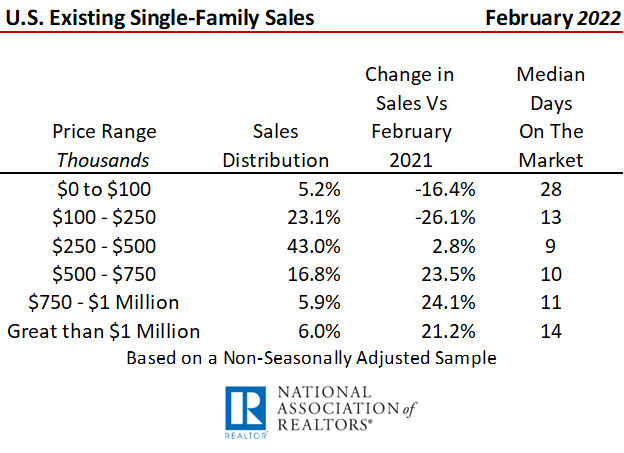
Single-Family Sales by Price and Median Days on the Market Prior to an Accepted Purchase Contract _– sample data not seasonally adjusted_
Primary reason sales priced $250,000 and less are down is minimal inventory
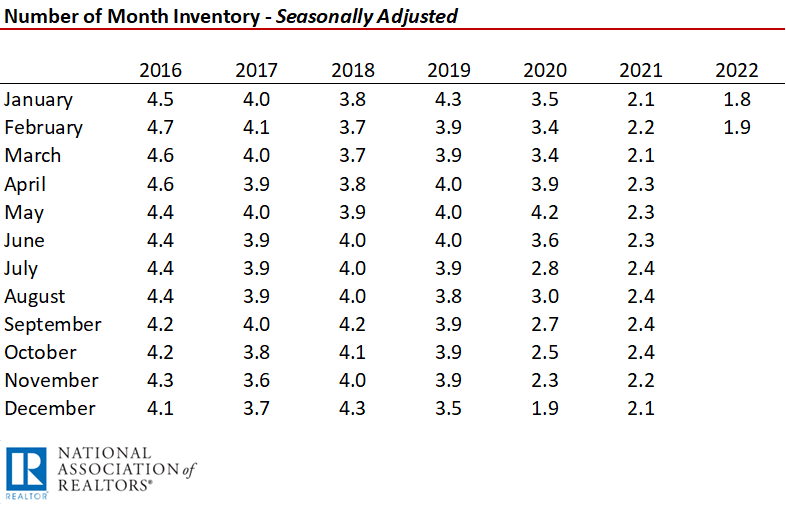
Months Inventory – with 6.0 months inventory considered normal on an historical perspective – _Seasonally Adjusted_
Graphs
Other Details Included in the NAR February 2022 Release
Median price has risen 120 consecutive months on a year-over-year basis
Inventory edged up 2.4 percent from January 2022 to February 2022 to a miniscule 870,000 active listings and was down 15.5 percent compared to February 2021
Months Inventory at the end of February 2022 was 1.7 months (not seasonally adjusted), slightly improved from the record-low 1.6 months in January this year
Typical property was on the market 18 days prior to an accepted purchase contract, down from 20 days in January 2022 and 20 days one-year ago
84 percent of homes closed in February 2022 were on the market less than one month before going under contract
1st time homebuyers accounted for 29 percent of February closings, down from 31 percent one-year ago. Continuing erosion of affordability will no doubt negatively impact 1st-time homebuyers ability to access the great American dream given rising prices and rising interest rates
Investors purchased one-in-five homes (19 percent) sold in February 2022, down from 22 percent in the prior month but up from 17 percent 1-year ago
Buyers paid all-cash (no mortgage loan involved) in one-in-four closings (25%) up from 22 percent one-year ago
Distressed sales – foreclosures and short sales – are still not an issue making up less than 1 percent of February 2022 transactions -- unchanged from the prior month & year-over-year. Most homeowners unable to make their mortgage payments today merely need to list the property with a real estate agent and prepare to walk with equity from a closing sometime in the next 30 to 60 days in this tight housing market
To read the full press release from NAR click nar.realtor/newsroom/existing-home-sales-fade-7-2-in-february
Headwinds in 2022 include rising interest rates, affordability issues and uncertainty of the economy given the ever-evolving pandemic and now global conflicts. A major anticipated change is cooling of the rocketing trajectory of median prices (up 15.0 percent in the 12-months ending February 2022). Current median price gain forecasts are shown below in one of my Tweets from Mid-March.
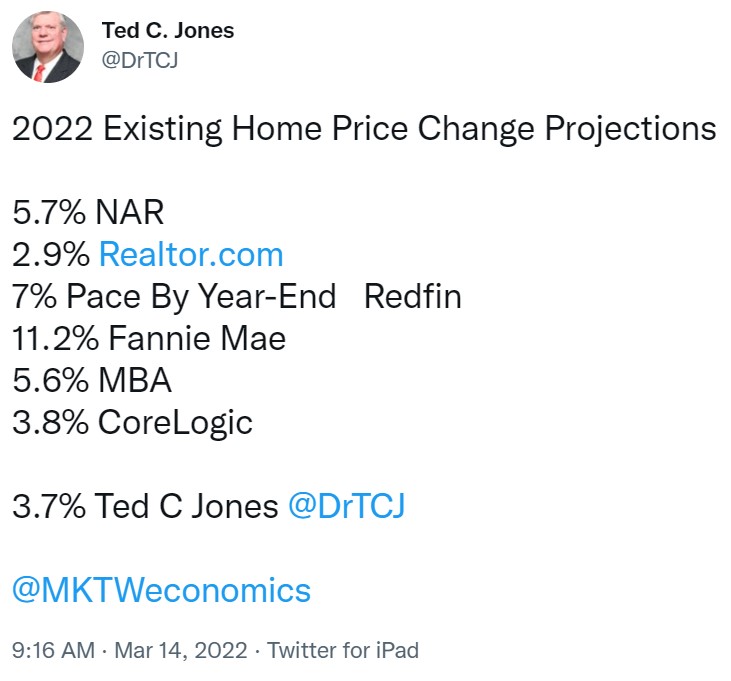
Housing is still hot, but escalating rates and prices may change that significantly. If Fannie Mae is correct, the principle and interest payment in 2023 on the median-priced existing home in the U.S. (assuming 20 percent down) will be up 48.7 percent compared to 2020 while the MBA’s forecast of interest rates and home prices sees that increase rocket up 54.8 percent. Both are sobering metrics.
Follow me on Twitter at twitter.com/DrTCJ
Given the changes in how buyers search for homes and the technology utilized, it is time to revisit what defines normal inventory. With the typical home receiving an accepted offer in 18 days in February 2022, the time from listing-to-contract continues to compress.