
U.S. Census Estimated Population Change 2021 to 2022 and Why - by State and The District of Columbia

After sinking to the lowest percentage population growth in 2021 since the U.S. became a nation in 1776 (a minuscule 0.1 percent), growth rose by four times that amount in 2022 to 0.4 percent, according to estimates from the U.S. Census Bureau. Population gain alone does not guarantee economic growth. Changes from one year to the next, in general, show where people are departing and where they (and their jobs—typically) are landing. Work From Home (WFH) and Work From Anywhere (WFA) have changed that dynamic, however.
Fortunately, the U.S. remains among the very few economically developed countries that continues to enjoy population growth. From July 1, 2021, to July 1, 2022, the U.S. population grew from 332,013,554 people to an estimated 333,287,557, according to the Vintage population estimates by the U.S. Census Bureau—a gain of 1.256 million people. These data do not include undocumented migrants crossing the southern border.
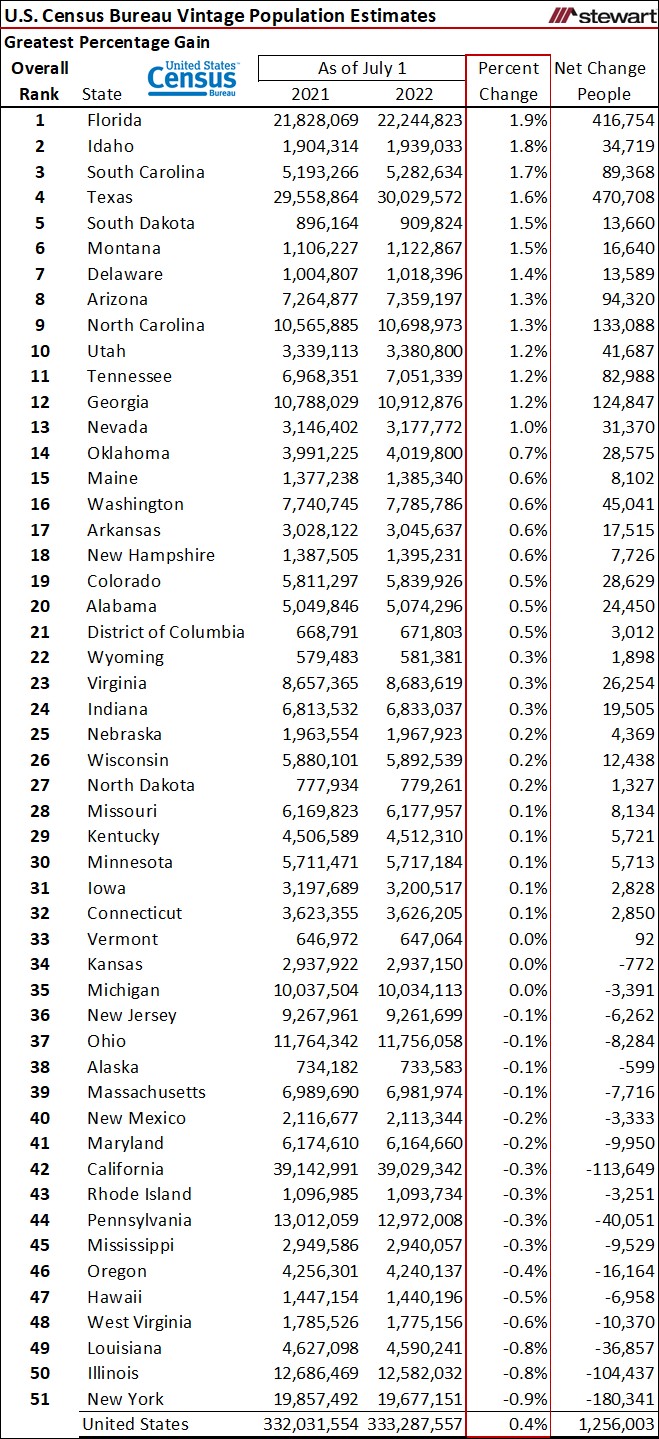
The 2020 Census serves as the foundation for the 2022 Vintage population estimates, which then incorporate data from births, deaths, and both domestic and international migration. Just as with job growth from one state to another, population change varies across the country. The first table shows the 50 states and the District of Columbia sorted by the greatest percentage growth in population from 2021 to 2022. Florida was the top-growth state percentage-wise at 1.9 percent—five times that of the U.S. overall. The next four included Idaho (+1.8%), South Carolina (+1.7%), Texas (+1.6%), with South Dakota and Montana tied at 1.5%. The largest declines were New York (-0.9%), Illinois and Louisiana (-0.8%), West Virginia (-0.6%), and Hawaii (-0.5%).
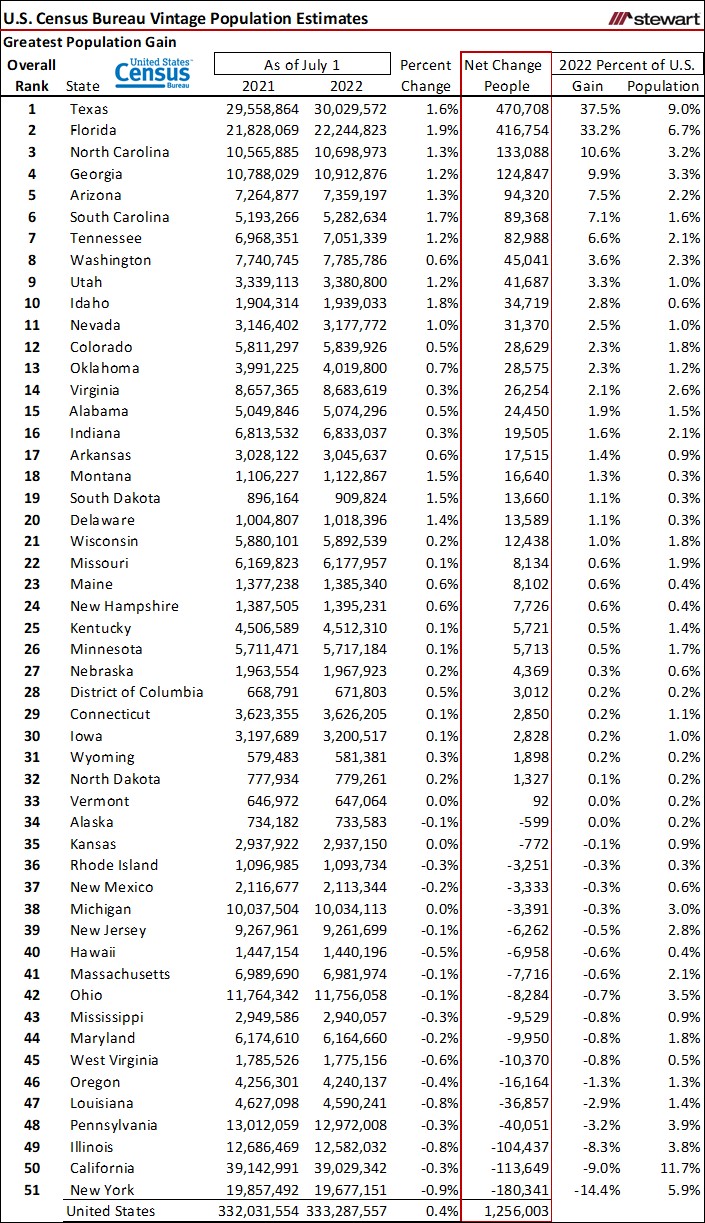
States are ranked by the net change in population numbers from 2021 to 2022 in the next table. Texas posted the largest one-year net gain in population (up 470,708), which numerically covered the population losses of New York, California, Illinois, Pennsylvania, and Louisiana combined (a total decline of 475,335 in 2022). Even though Texas made up just 9.0 percent of the total U.S. population in 2022, the Lone Star State accounted for 37.5 percent of the net population gain nationwide. Five states made up more than 98 percent of the total U.S. population gain in 2022: Texas, Florida, North Carolina, Georgia, and Arizona. Two states—Vermont and Alaska—essentially had zero population change in 2022, while 17 states showed a loss. New York took the dubious honor of not only losing the most people but also having the largest percentage population decline in 2022.
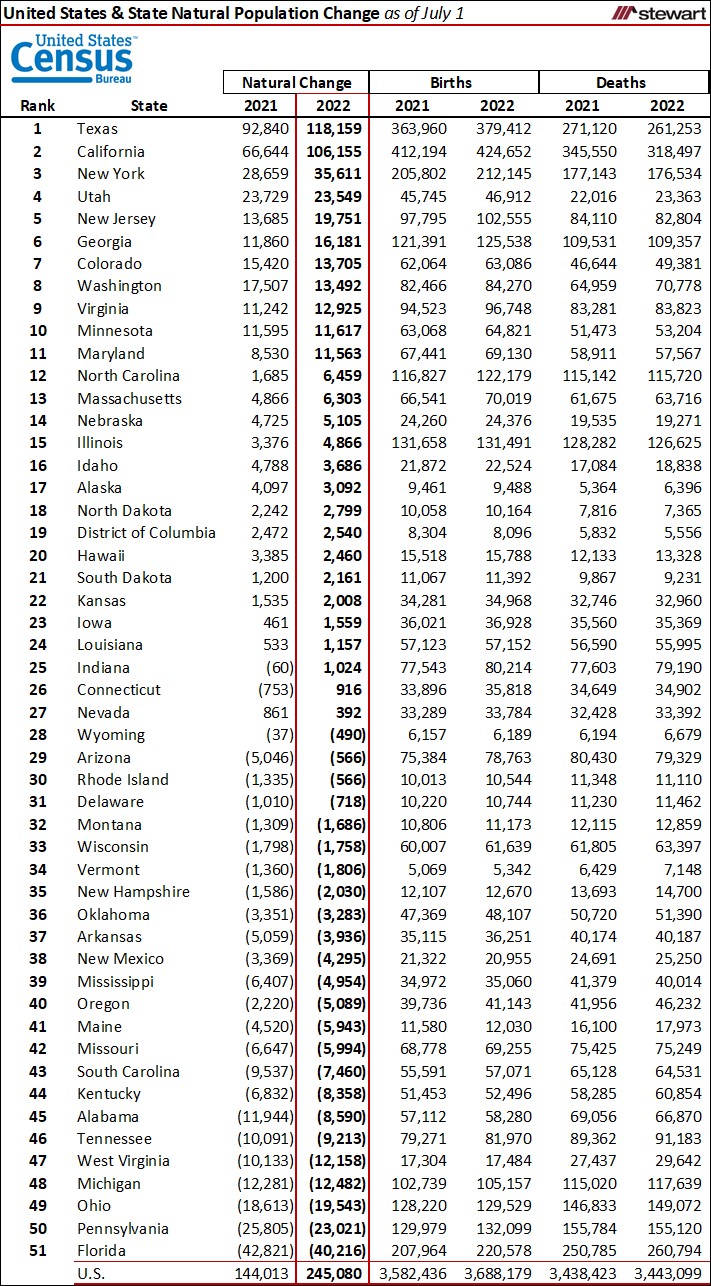
Population growth (or decline) is a function of net natural increase (births minus deaths) and migration (both international and state-to-state). The next table shows natural population change calculated by subtracting deaths from births. Almost one-half of the states (24) posted a shrinking natural population in 2022. Even though New York posted the largest total population decline in 2022, down 180,341 people, the natural population increased by 35,611. Florida had 40,216 more deaths than births but, thanks to migration, came in with a net increase of 416,754 more people.
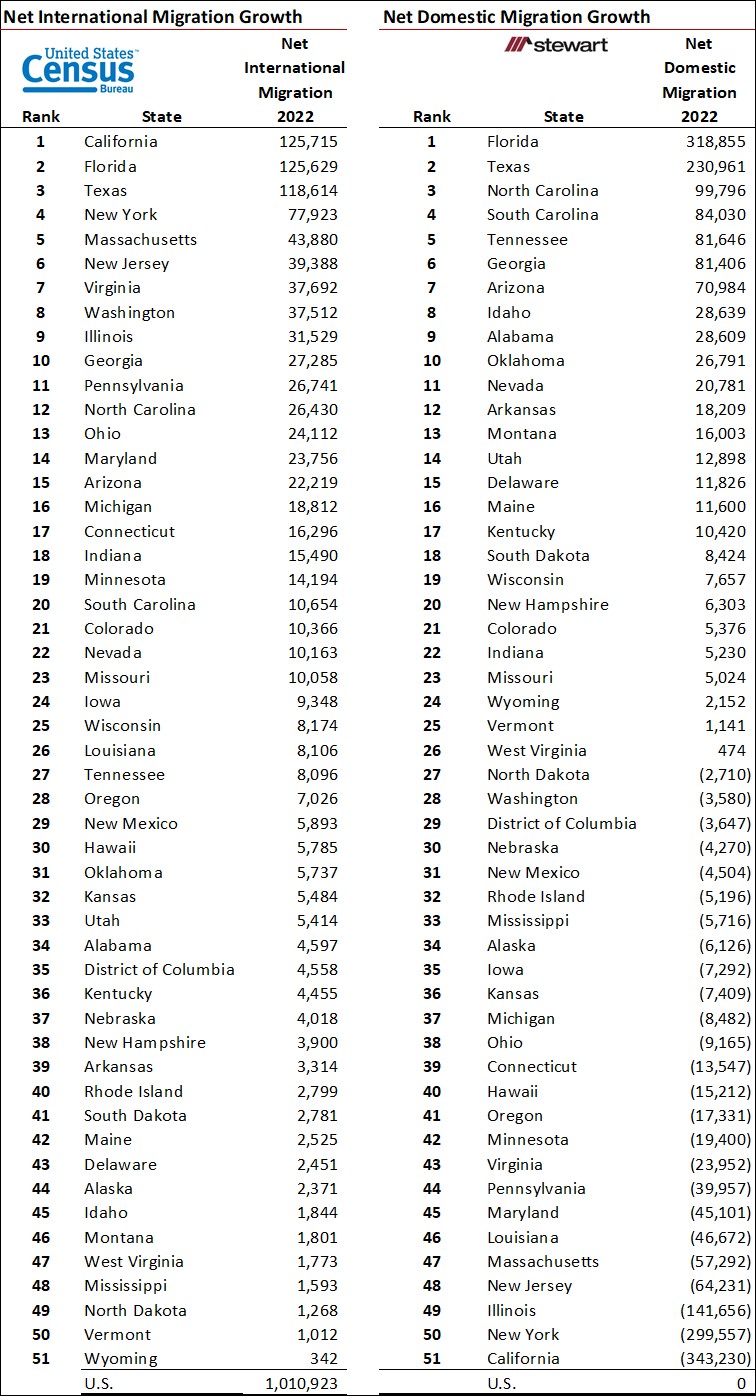
Domestic and international migration net flows also impact population. The next table shows net migration in 2022, which includes international and domestic flows. International migration totaled 1,010,923 in 2022—three times that of the pandemic-impeded 2021. Florida was the big winner in migration, gaining a total of 444,484 people relocating from out-of-state (318,855) and internationally (125,629). Even though California had the most international inbound migrants at 125,715, the state lost 343,230 residents that moved out-of-state in 2022.
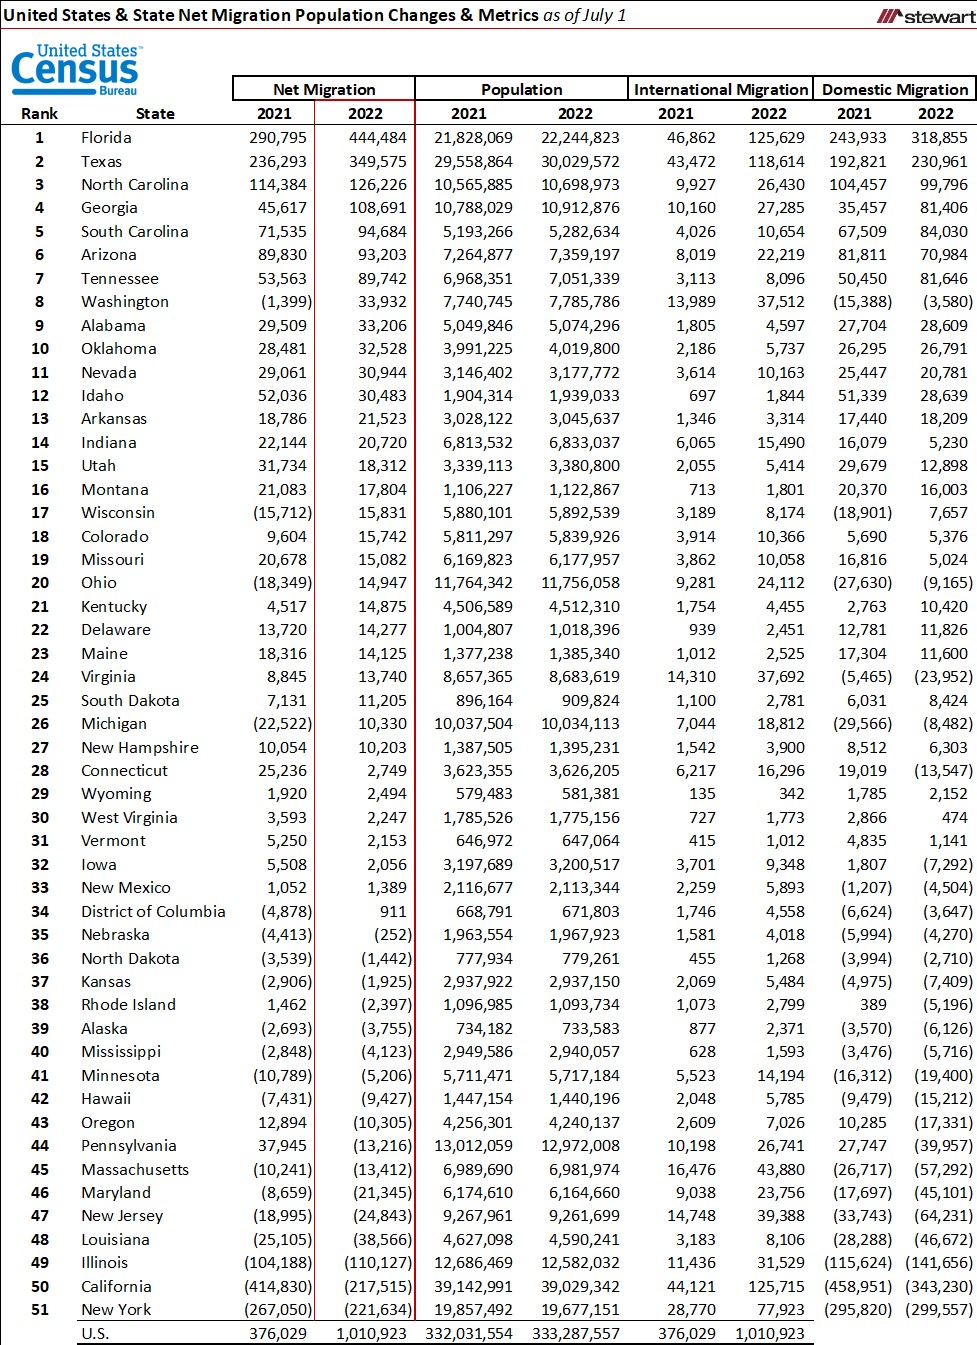
Individual rankings of international and domestic migration are detailed in the next table. Every state and the District of Columbia posted a positive net international migration growth in 2022. Domestic migration was positive for 26 states.
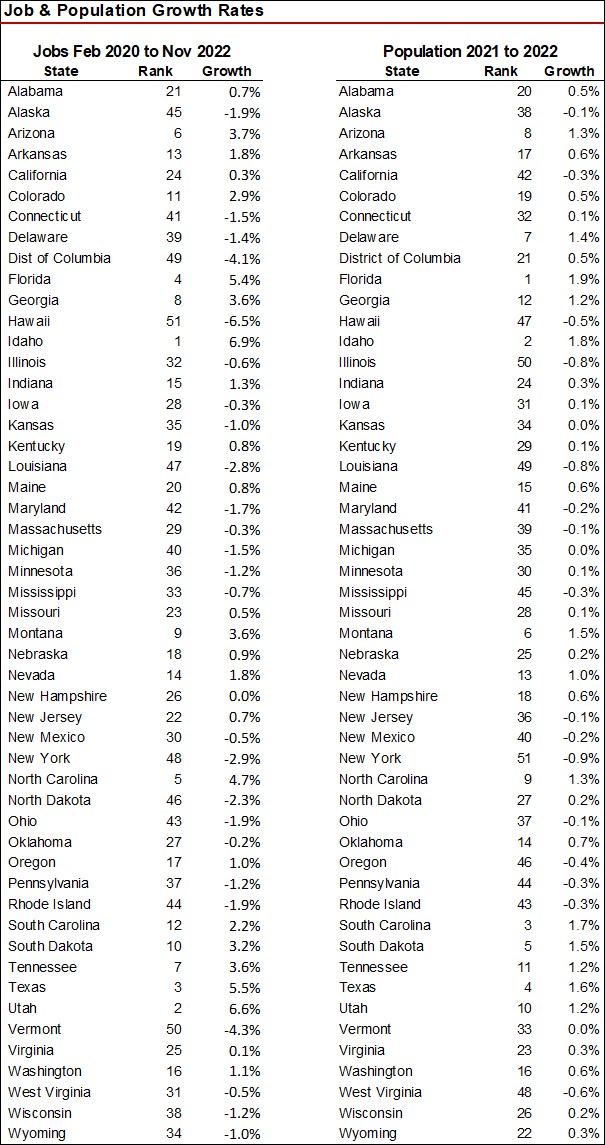
While population growth (or loss) does not automatically correlate to job changes, the last table shows the percent population change (and rank) from 2021 to 2022 and the same metrics for net job growth from February 2020 (the month prior to the pandemic) through November 2022. Population growth in 2022 and job growth from pre-pandemic to November are highly correlated and statistically significant.
For those into statistics, the Pearson Product Moment Correlation Coefficient is 0.76555 and the Spearman Rank Correlation Coefficient 0.71846, with each having a P-Value of less than 0.00001. In plain speak, this means that for most states, those with population gains also had strong job growth, while population declines went along with weak job gains or literal losses. There were outliers to these statements, however. Delaware, for example, had a population growth rate of 1.4 percent (7th best overall) but the 39th worst (-1.4%) job performance from pre-pandemic (February 2020) through November 2022. Other anomalies included the District of Columbia (21st best population growth and ranked 49th in jobs) and Oregon with the 17th best job gains but 46th best population change.
Click here to read the press release from the U.S. Census Bureau on Vintage population estimates, or visit https://www.census.gov/newsroom/press-releases/2022/2022-population-estimates.html.
Click here to download the various Vintage population estimate data tables, or visit https://www.census.gov/programs-surveys/popest/data/tables.html.
There always have been winners and losers in demographic and economic factors, but the pandemic accelerated these changes across the country. Change is inevitable, but the rate and direction vary across the economic landscape at any point in time.
Ted