
Existing Home Sales Down 17.8 Percent in 2022 as Affordability and Economic Uncertainty Take Their Toll on Buyers

Following a 35 percent plunge in existing home sales in November 2022 on a year-over-year basis, December came in down 36.3 percent according to the National Association of Realtors®. On a seasonally adjusted annualized rate (SAAR) sales were down 34.0 percent year-over-year and off 1.5 percent sequentially from November. Sales have now declined for 11-consecutive months on a SAAR for the first time in history. Single-family home were off 35.7 percent for the year in 2022 Vs 2021 and condo-Co-op sales down 41.1 percent. Total sales in 2022 of 5.03 million were down 17.8 percent from 2021.
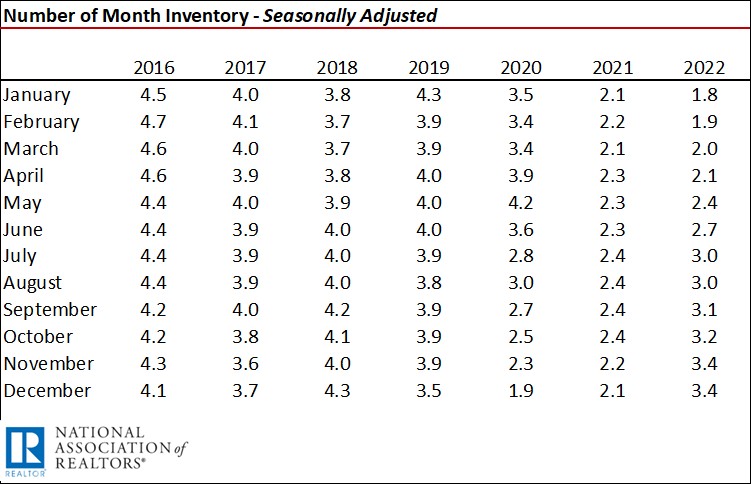
The 3.4 months of inventory on a seasonally adjusted basis was the greatest measured in the past 30 months and was up from 2.1 months a year ago.
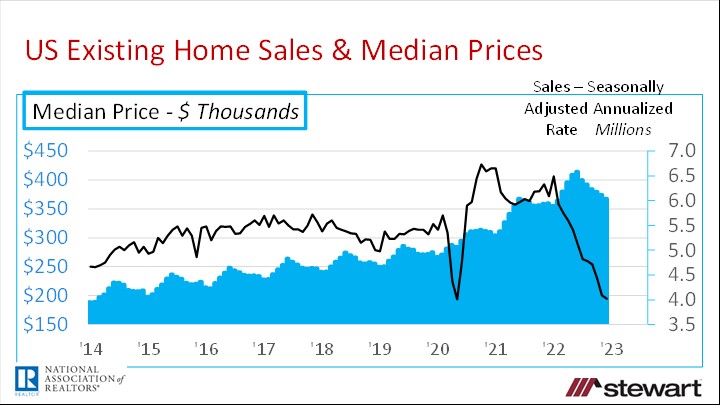
December median price was up just 2.3 percent to $366,900 in December compared to one-year ago but down from the June 2022 all-time record high of $413,800. Still, median prices have increased 130 consecutive months on a year-over-year basis, the longest upside streak in history.
Box Score -- Existing Home Sales December 2022 National Association of Realtors® (NAR)
Monthly Sales – raw data not seasonally adjusted
327,000 for the month December 2022
up 0.6 percent sequentially versus the 325,000 sales in November 2022
down 36.3 percent year-over-year versus the 513,000 sales in December 2021
Seasonally Adjusted Annualized Sales Numbers (SAAR)
4.02 million SAAR as of December 2022 – the fewest since May 2020 at the onset of the pandemic
down 7.7 percent sequentially from November 2022 sales of 4.08 million
down 34.0 percent year-over-year from 6.09 million in December 2021
Sales Trailing 12-Months – raw data not seasonally adjusted
5.026 million for the 12-months ending December 2022 – raw data not seasonally adjusted
down 17.9 percent vs 12-months ending December 2021 of 6.12 million
down 3.6 percent sequentially from November 2022 of 5.212 million
Median Price – December 2022 due to historic monthly seasonality of existing home prices, only a year-over-year comparison is made
$366,900 – not seasonally adjusted
up 2.3 percent vs $358,800 December 2021
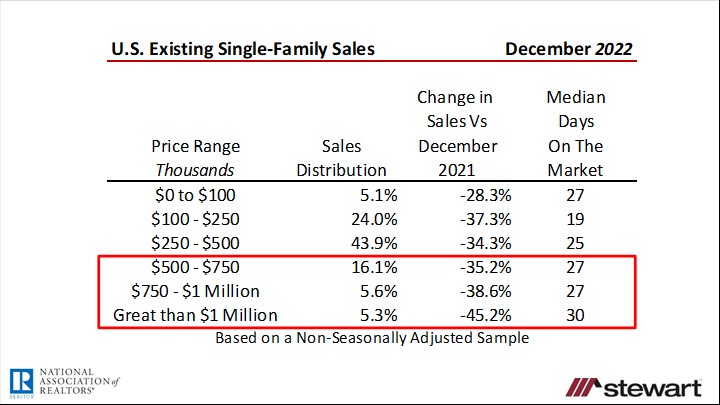
Single-Family Sales by Price and Median Days on the Market Prior to an Accepted Purchase Contract
Since July 2022 sales have been down year-over-year in each and every price range reported by NAR.
Months Inventory – Seasonally Adjusted
Prior to the pandemic, 6 months of inventory for existing homes was considered normal. I do believe, however, with the full integration of online home searches and technologies such as virtual home tours, digital signatures and closing aids such as remote online notarizations, the new normal is one-half the pre-pandemic levels. Thus I would argue that the U.S. overall now is normal in the relative number of listings. The current months of inventory of homes available for sale is tied for the most in the past 30 months. The number of months of inventory is not a factor in December reduced home sales and was almost double the 1.8 months inventory in January 2022.
Graphs
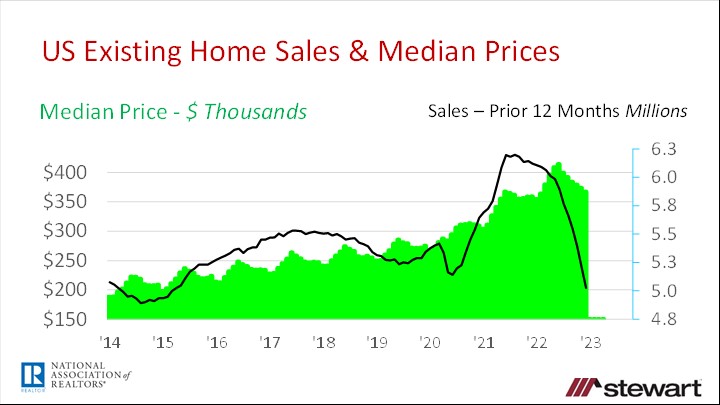
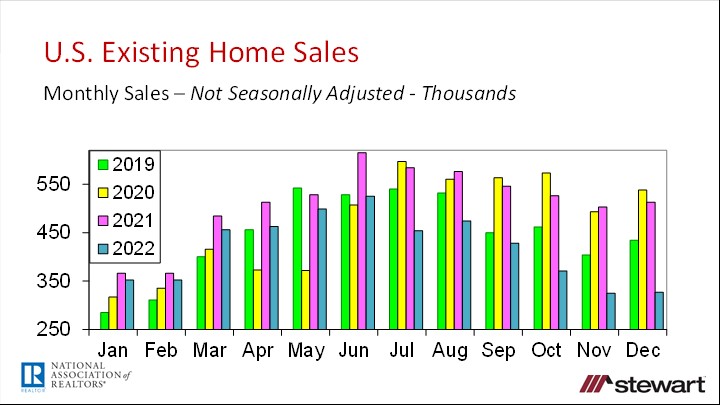
The next graph shows the raw, unadjusted number of monthly home sales annually from 2019 through December 2022. The real comparison is not monthly 2022 sales numbers to 2020 or 2021 as these data are anomalies due to the pandemic. The only time to look at 2020 and 2021 data in the future will be during the next pandemic to serve as a gauge in forecasting sales and market behaviors at that time. Since the last normal market was 2019, comparison of 2022 data should be made to 2019. Sales in 2022 have dropped for eight consecutive months sequentially. The erosion in monthly home sales comparing 2019 to 2022 has been -7.9 percent in May, -0.6 percent in June, -15.9 percent in July, -10.9 percent in August, -4.9 percent in September, -19.7 percent in October, -19.6 percent in November and -24.7 percent in December.
Other Details Included in the NAR December 2022 Release
Listing inventory of 970,000 units in December 2022 was down 13.4 percent sequentially from November but up 10.2 percent compared one-year ago
Typical property was on the market 26 days prior to an accepted purchase contract versus 19 days one-year ago
57 percent of homes closed in December 2022 were on the market less than one month before going under contract
1st time homebuyers accounted for 31 percent of November closings, up slightly from 30 percent one-year ago
Investors purchased 16 percent of the homes sold in December 2022 versus 17 percent in the same month last year
Buyers paid all-cash in three-in-every-ten sales (28 percent), up from 23 percent one-year ago
Distressed sales – foreclosures and short sales – made up 1 percent of all closings, unchanged from one-year ago
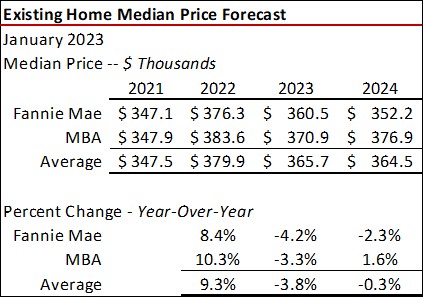
The latest forecast for annual existing home sales and median prices from Fannie Mae and the MBA as of January 2023 are shown in the tables. Fannie Mae is predicting the fewest number of existing home sales in 2023 since 1995 at less than four million, down another 22.4 percent year-over-year. The MBA sees existing home sales dropping 12.8 percent in 2023. Both forecast slight median price declines in 2023, down from 3.3 percent to 4.2 percent compared to 2022.
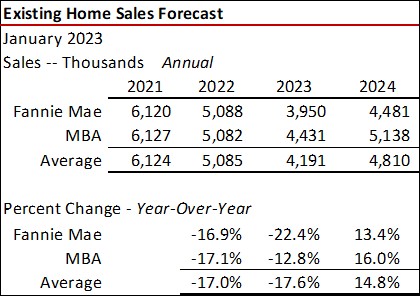
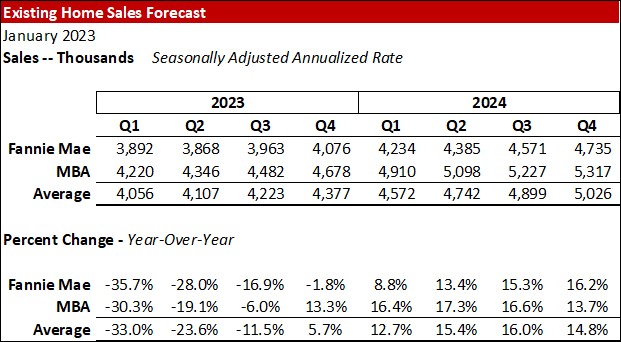
Quarterly existing home sales forecasts are detailed in the next table. While the MBA sees an uptick in existing home sales in Q4 2023 on a year-over-year basis, Fannie Mae expects a decline in every quarter recovering Q1 2024.
To read the full press release from NAR click here.
Home Sales Pipeline – NAR Pending Home Sales December 2022 The just-released National Association of Realtors’ Pending Home Sales Index (newly signed home-purchase contracts) for December 2022 was down 33.8 percent compared to 1-year ago but up 2.5 percent sequentially from November. Pending home sales typically make up closings for the next 30 to 60 days.
It’s going to be a challenging three or four quarters for existing home sales in 2023 based on the current outlooks.
Follow me on Twitter at twitter.com/DrTCJ
Ted