
Jobs Are Everything: MSA Job Growth April 2023

10-Year, 5-Year & 1-Year, Pandemic Performance and Other Metrics
Jobs are everything when it comes to analyzing the economy and the ultimate demand for real estate. The U.S. Bureau of Labor Statistics (BLS) releases job numbers and related metrics monthly for 380 Metropolitan Statistical Areas (MSAs). Seasonally adjusted data are summarized in the following analyses facilitating an apples-to-apples comparison of any month to another. The onset of the pandemic in March 2020 saw the U.S. lose 22 million jobs from pre-pandemic employment counts (February 2020) to April 2020. Today, however, the U.S. has more jobs than any time in history. The incidence of loss and recovery rates vary widely across MSAs, however. The TINSTAANREM axiom is applicable — There Is No Such Thing As A National Real Estate Market or economy. The same is true with respect to job losses and respective recovery rates across metros today.
The first table shows the 40 MSAs with the best job performance rates from February 2020 (the month prior to the pandemic) through April 2023. Within the 380 MSAs, 245 (64.5 percent) now have more jobs than ever before in history, three have the same number of jobs (0.8 percent), and 132 still lag in job numbers (34.7 percent). Nine MSAs now have at least 10 percent more jobs than prior to the pandemic:
- +20.7% The Villages, Florida
- +14.9% St George, Utah
- +14.3% Austin-Round Rock-San Marcos, Texas
- +13.7% Logan, Utah-Idaho
- +13.2% Idaho Falls, Idaho
- +12.6% Provo-Orem, Utah
- +12.4% Lakeland-Winter Haven, Florida
- +11.3% Fayetteville-Springdale-Rogers, Arkansas-Missouri
- +11.3% Boise City, Idaho
-

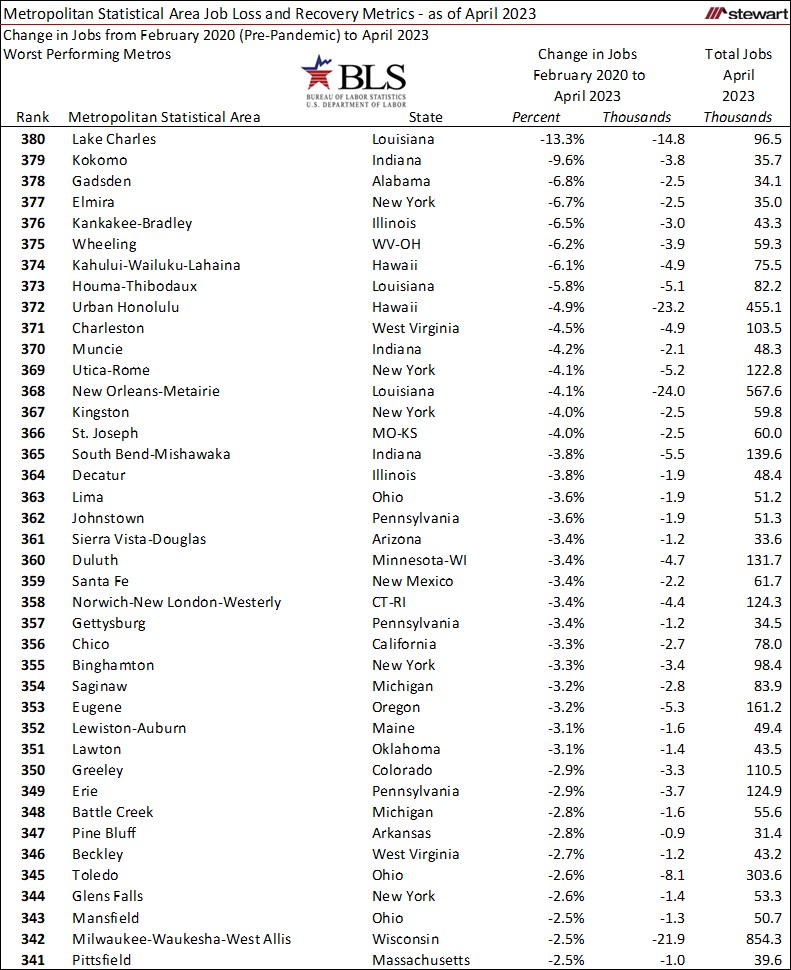
The 40 worst performing MSAs from February 2020 (the month prior to the pandemic) through April 2023 are detailed in the next table.
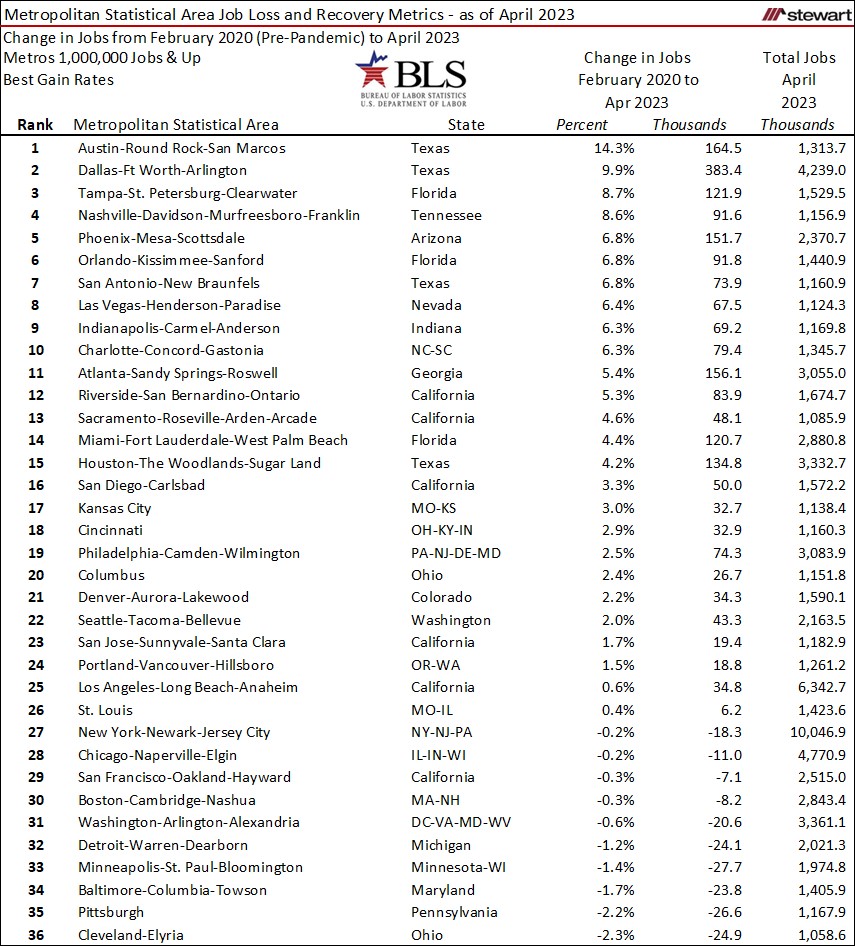
Total U.S. employment was 155.7 million as of April 2023. More than one-half of all U.S. jobs (53 percent) were in the 36 MSAs totaling 1-million or more jobs. Among the MSAs with a minimum 1-million jobs, 26 (72.2 percent) now have more jobs than ever before. A massive 87.8 percent of all U.S. jobs are located in the 380 MSAs, with just 12.2 percent in rural areas, smaller towns, and areas not included in the metros.
Details of the 1+ million job MSAs are in the following table.
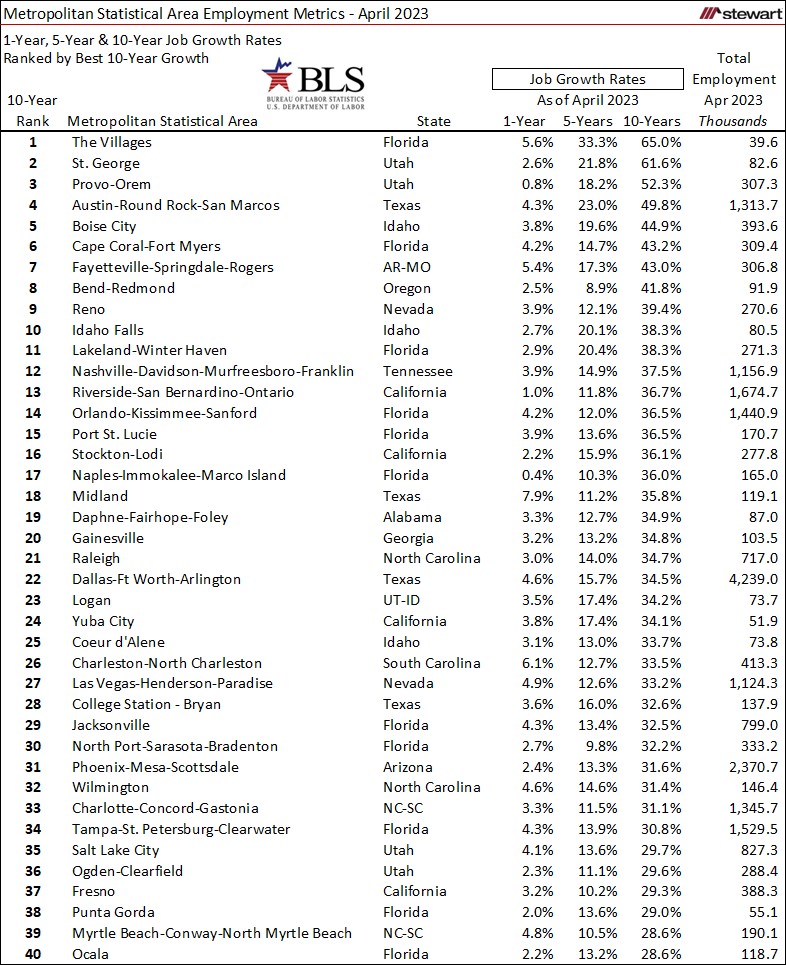
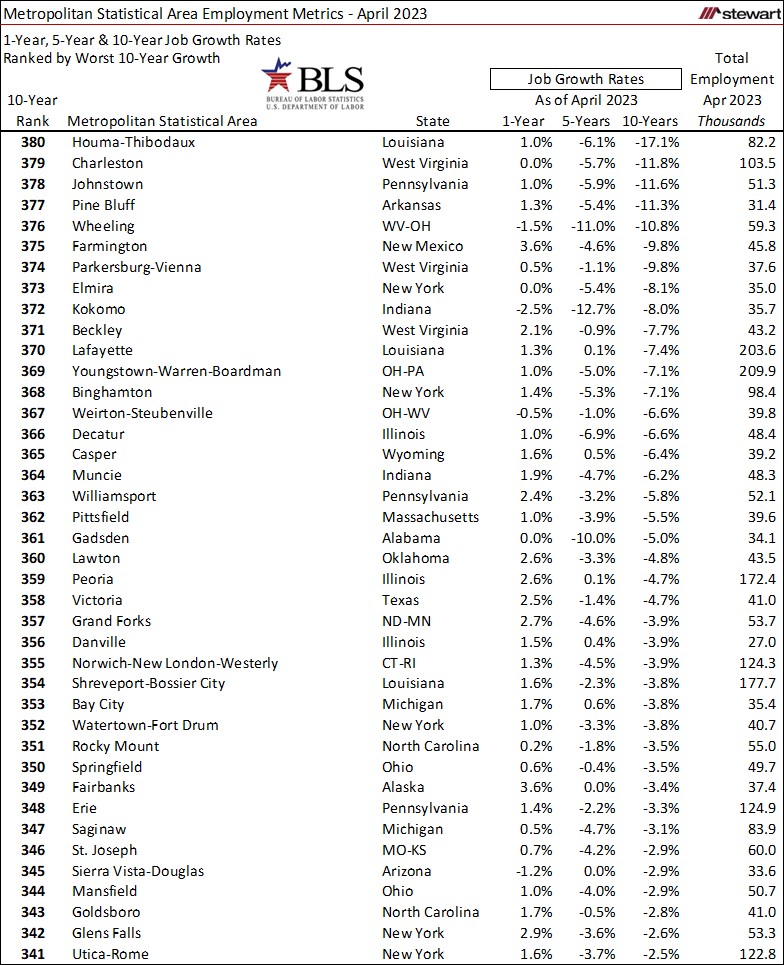
The next tables show the 40 MSAs with the best and worst percentage gain in jobs in the 10-years from April 2013 to April 2023. Also included are job growth rates for 1-year and 5-year intervals and total employment numbers as of April 2023. The MSA with the greatest job gain percentage in the 10-year period was The Villages, Florida which increased jobs by 65.0 percent. Two additional MSAs grew at least 50 percent in the 10-year period: St George, Utah (+61.6 percent) and Provo-Orem, Utah (+52.3 percent). In contrast, Houma-Thibodaux, Louisiana had the worst job growth performance having lost almost one-out-of-every-6-jobs (17.1 percent) in the 10-years ending April 2023.
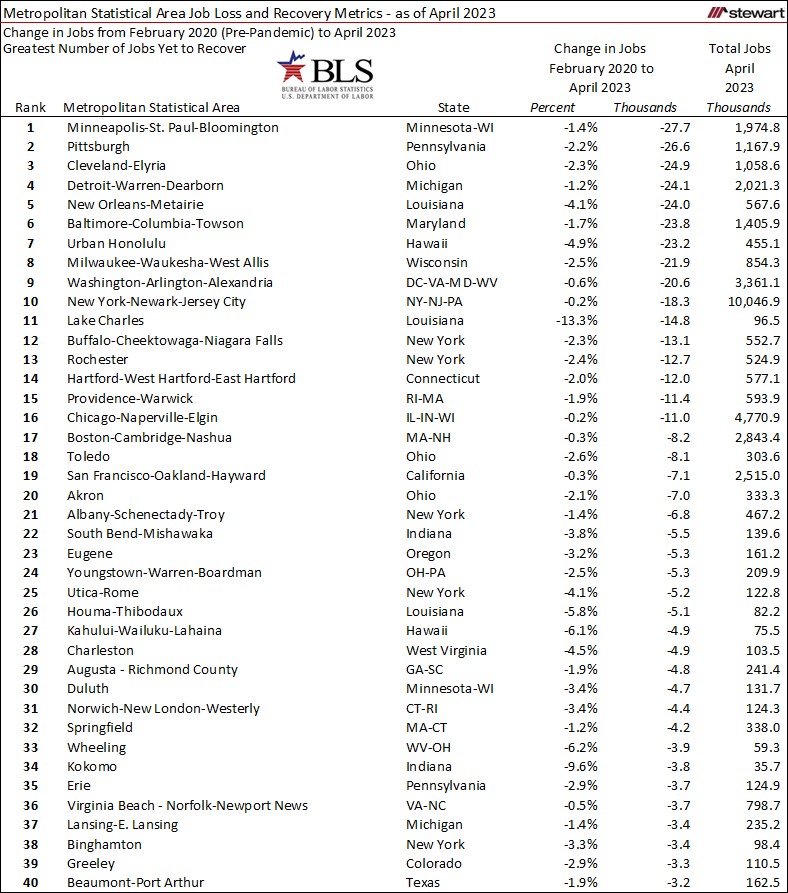
The 40-MSAs with the greatest number of jobs still missing since the onset of the pandemic are detailed in the next table. Minneapolis-St Paul-Bloomington MSA had 27,700 more jobs in February 2020 than April 2023, the largest pandemic-related job deficit in the country. In contrast, Dallas-Ft Worth-Arlington MSA now has 383,400 more jobs than February 2020, the largest increase nationwide.
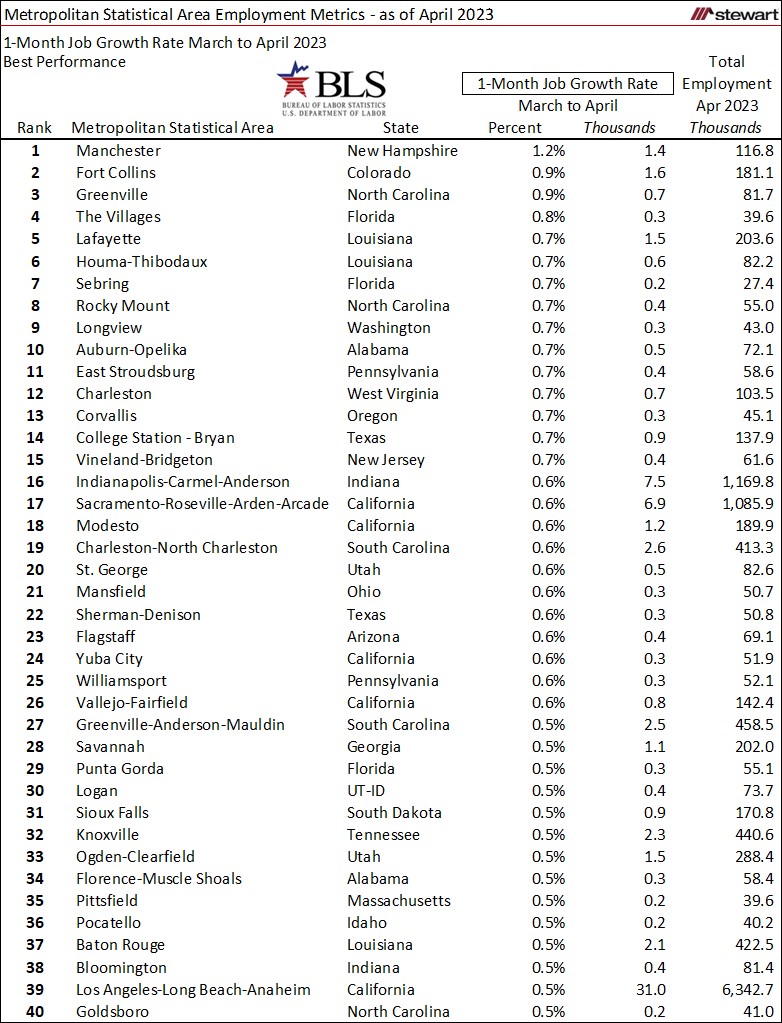
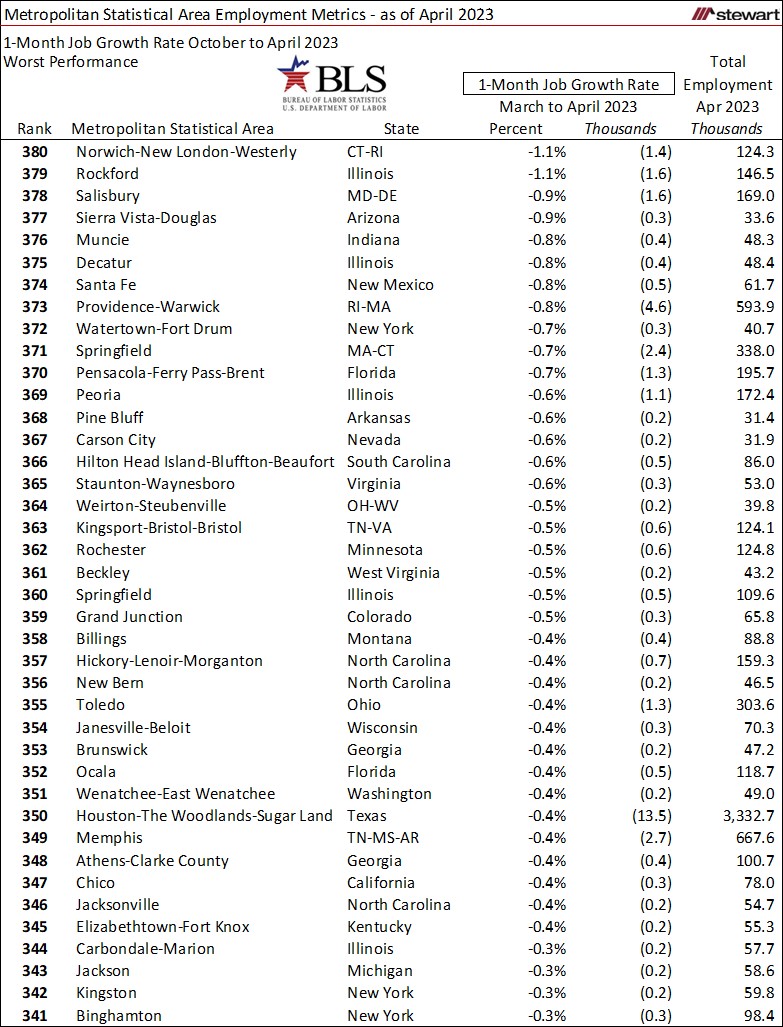
The last two tables show 1-month job growth rates for 40 best- and worst- performing MSAs. The largest percentage gain of jobs in the past month was Manchester, New Hampshire, up 1.2 percent adding 1,400 net additional jobs. Norwich-New London-Westerly, Connecticut-Rhode Island MSA posted the greatest percentage job decline, down 1.1 percent dropping 1,400 jobs in one-month.
Two PDFs noted here, are each sorted by state and MSA. One contains the 1-5-10 year job performance levels and the other the latest 1-month, 12-month and pre-pandemic to April 2023 metrics along with other related employment statistics for all 380 MSAs.
Jobs are everything. For many MSAs there is good news regarding the economy and where real estate markets are heading. However, 132 MSAs as of April 2023 had fewer jobs than February 2020, showing the economic diversity across the geographic landscape.
Ted