
New Home Sales Ignite as Existing Home Sales Sputter -- July 2023

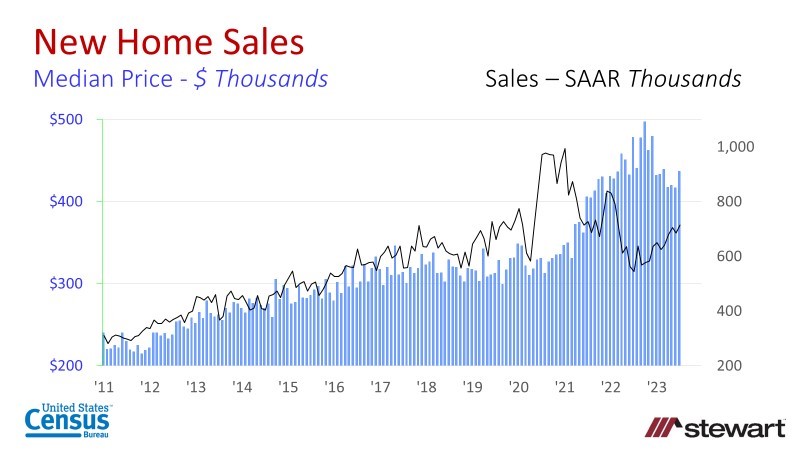
New home sales were up an impressive 31.5 percent in July 2023 vs. 1-year ago and up 4.4 percent sequentially from June this year on a seasonally adjusted annualized rate (SAAR), according to the U.S. Census Bureau. In comparison, existing home sales were down 16.6 percent year-over-year and off 2.2 percent sequentially from the prior month as reported by the National Association of Realtors® (NAR). New home sales median price was down 8.7 percent in July year-over-year to $436,700, while existing home sales price at $406,700 was up 1.9 percent in the same period.
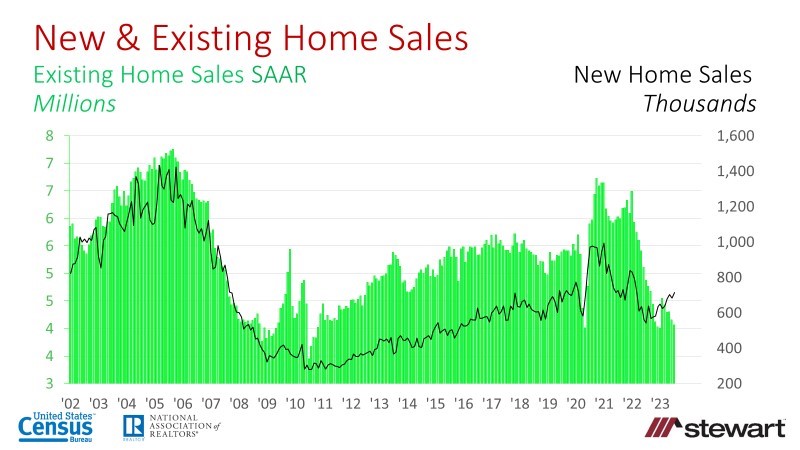
The number of new home sales on a SAAR along with median prices are detailed in the first graph commencing in 2011. The second graph compares new and existing home sales numbers. New home sales were up 8.0 percent from July 2019 (the year prior to the pandemic) vs. July 2023, the reverse of existing home sales which were down 24.5 percent in the same period.
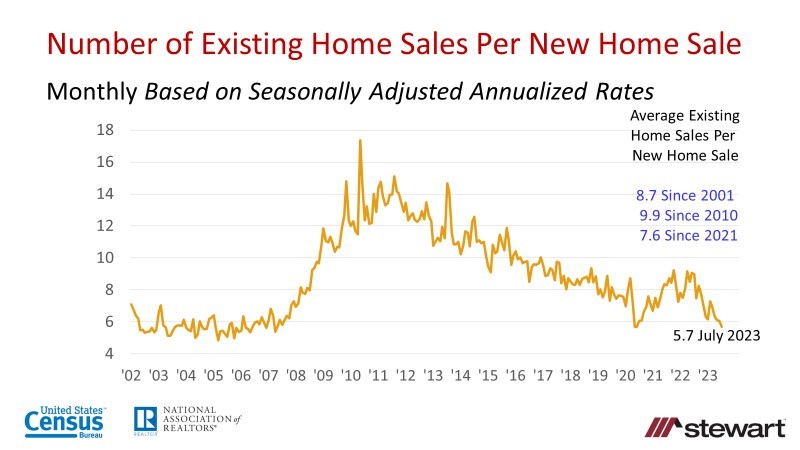
Since 2001, there have been an average 8.7 existing home sales for every new home sale, but July 2023 saw a new home sale for every 5.7 existing home sales as existing home sales cooled and new home transactions heated up.
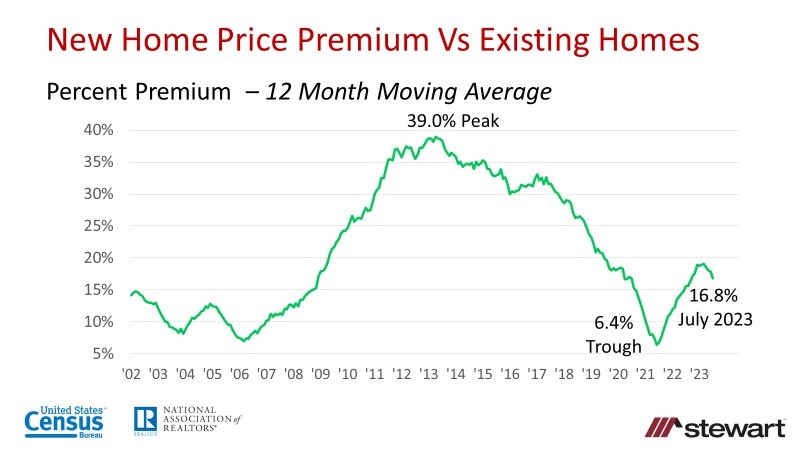
New and existing home sales median prices are detailed in the next two graphs. The first details monthly median prices and the second the new home sales price premium on a 12-month moving average basis. Since 2001 there have been just two months in which the new home median price was less than the existing home median: June 2005 (1.5 percent less) and June 2021 (1.4 percent lower). Since 2001 the new-home median price premium averaged 21.1 percent.

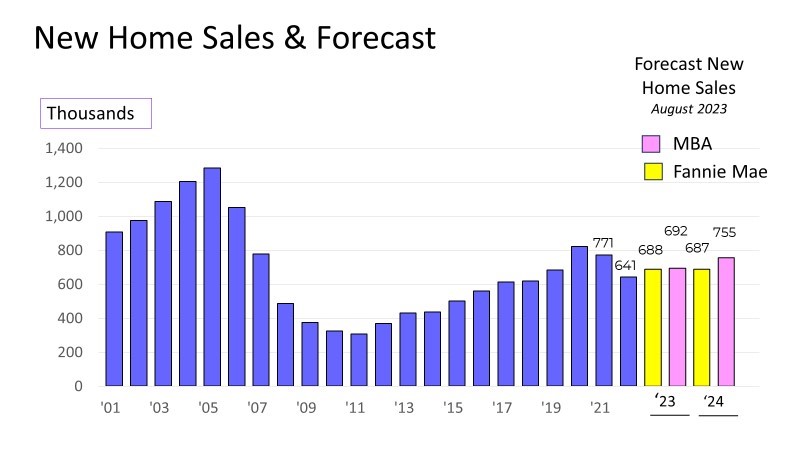
Historical new home sales along with forecasts for 2023 and 2024 from Fannie Mae and the MBA are shown in the last graph. Fannie Mae sees little change in new home sales in 2024 compared to 2023, while the MBA is more optimistic with a forecast 9.1 percent gain. The MBA’s more optimistic outlook is driven by their expectation of lower interest rates in 2024, averaging 5.5 percent compared to 6.3 percent forecast by Fannie Mae.
New home sales and existing home sales are not a direct apples-to-apples comparison. New home sales are counted when a home purchase contract is signed, while existing home sales are tallied when the property closes and changes ownership. The status of new home sales at the time of going under contract are detailed in the next table on both a seasonally adjusted annualized rate and simple raw sales numbers as of July 2023. Less than one-half of new home sales were completed at the time of sale (date purchase was contract signed).

To read the entire U.S. Census Bureau report on new home sales and to access historical data click www.census.gov/construction/nrs/data.html
Ted