
State Employment Metrics as of May 2023 Plus Latest 1-Year, 5-Year and 10-Year Changes

Following the 22-million job-loss plunge across the U.S. at the onset of the pandemic in March and April 2020, as of the end of May 2023, 37 states had as many or more jobs than any time in history according to the U.S. Bureau of Labor Statistics (BLS) using seasonally adjusted employment numbers. Just as job losses varied at that time from one state to another, the same is true for the recovery of jobs.
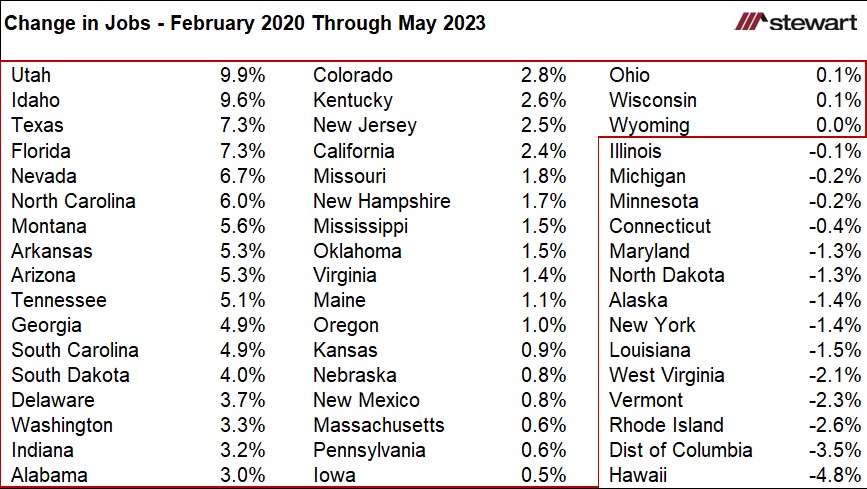
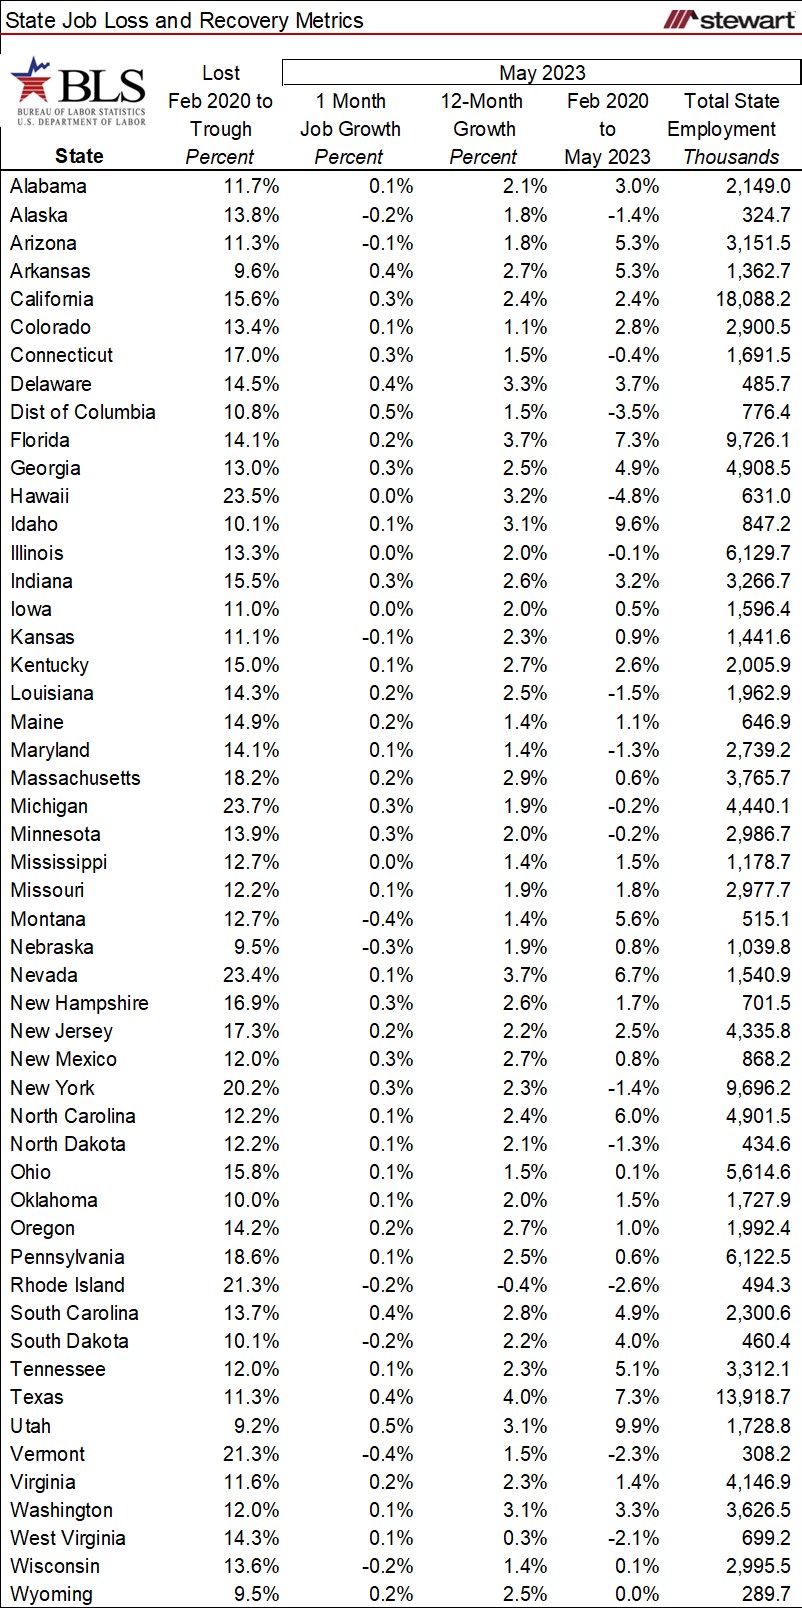
The first table shows the percentage change in jobs from February 2020 (the month prior to the pandemic) compared to May 2023, sorted by relative recovery rates. Also included is the District of Columbia. Idaho and Utah continue to be the job-growth leaders since the pandemic plunge, posting gains of 9.9 percent and 9.6 percent, respectively. Hawaii remains the laggard, still down 4.8 percent from the month prior to the pandemic, followed by the District of Columbia (-3.5%), Rhode Island (-2.6%), Vermont (-2.3%), and West Virginia (-2.1%).
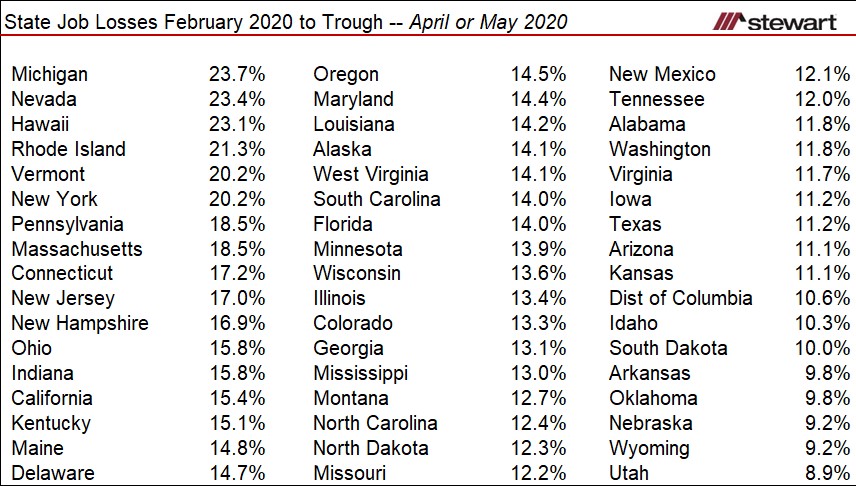
Not all states were equally impacted employment-wise by the pandemic, as shown in the next table. From February 2020 to the employment trough in April or May 2020, Michigan lost almost one in every four jobs (-23.7 percent) while Utah shed the fewest at just one in every 12 (-8.9 percent).
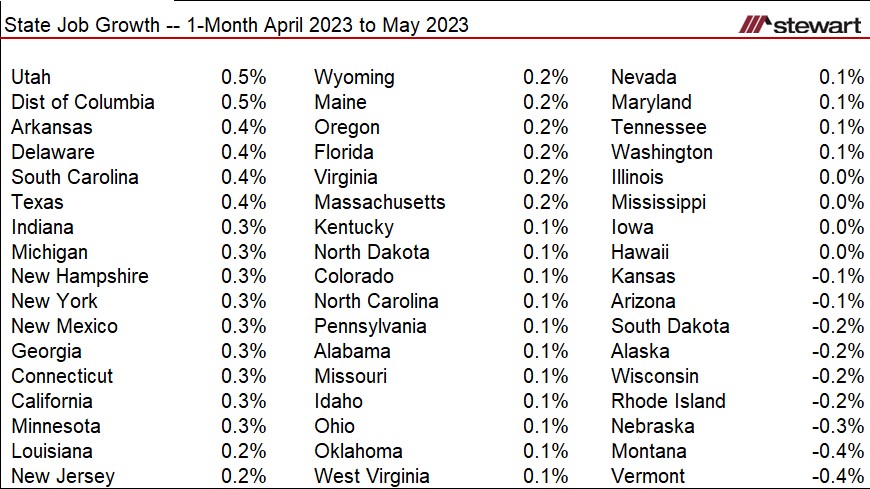
The latest one-month job growth from April to May 2023 is shown in the next table. Thirty-seven states plus the District of Columbia posted positive job growth in the past month, four were unchanged, and nine states lost jobs. Vermont lost the greatest percentage of jobs in the month, down 0.42 percent.
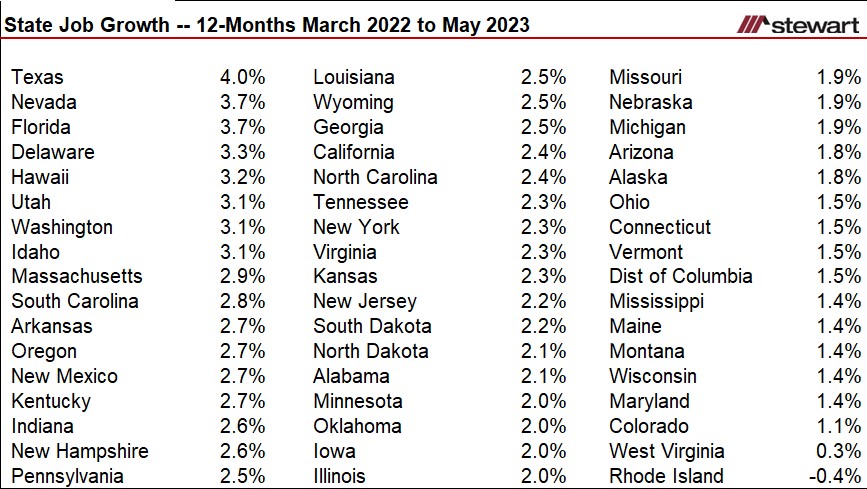
Job growth for the 12 months ending May 2023 is detailed in the next table. All but one state—Rhode Island (down 0.4 percent)—posted positive job growth in the past 12 months. Prior to the pandemic, I considered strong job growth to be greater than 2.0 percent in the prior 12 months. That now applies to two-thirds of the U.S. according to the latest BLS data. However, the question is whether these are net new jobs or merely those continuing to return following the 22-million job-loss plunge in 2020.
Employment metrics for all 50 states and the District of Columbia are detailed in the next table. Statistics include job growth rates for 1-month (April to May 2023), 12-months (May 2022 to May 2023), and from pre-pandemic to now (February 2020 through May 2023), plus total employment at the end of May 2023.
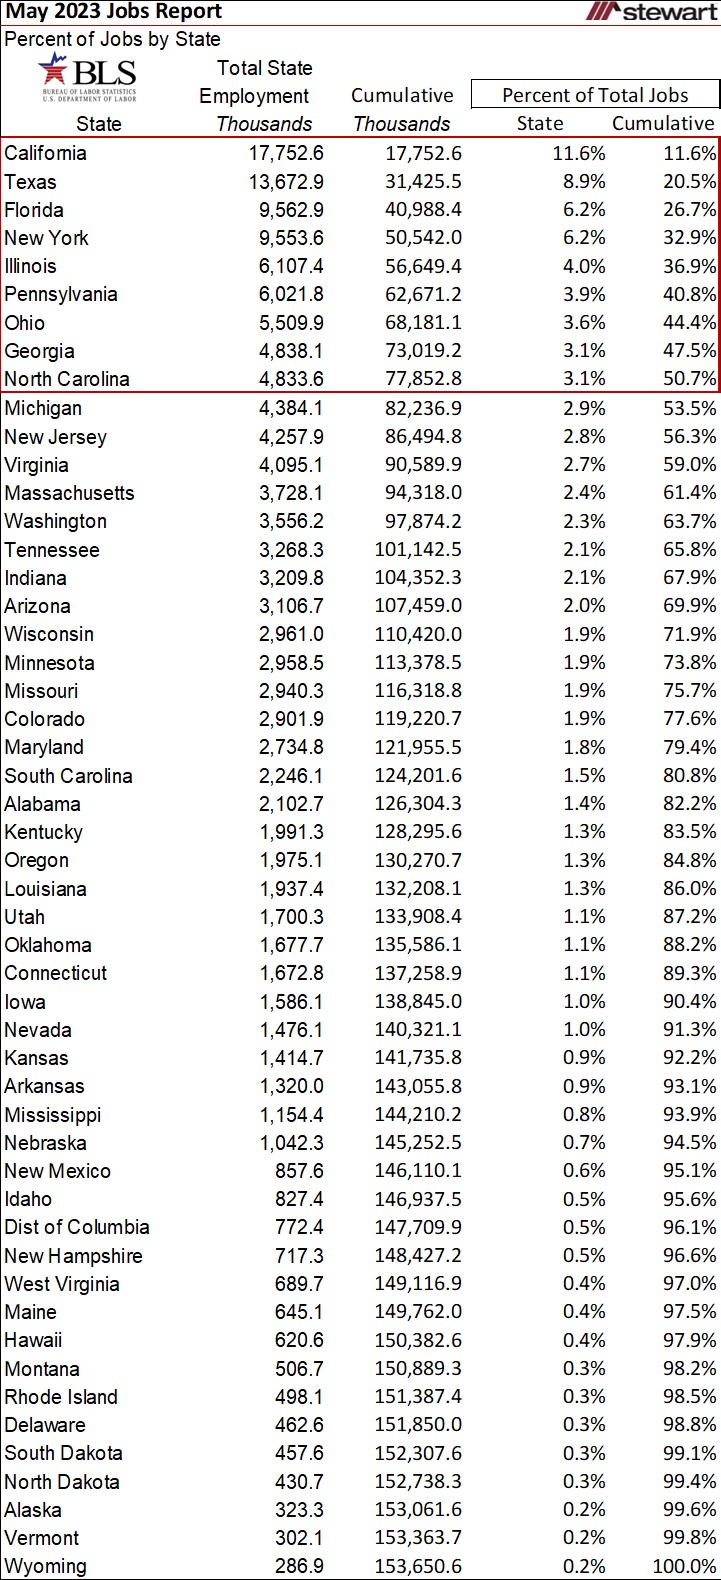
Nine states continue to account for more than one-half (50.7 percent) of all U.S. jobs, while 21 states with the fewest number of jobs combined do not even total 10 percent.
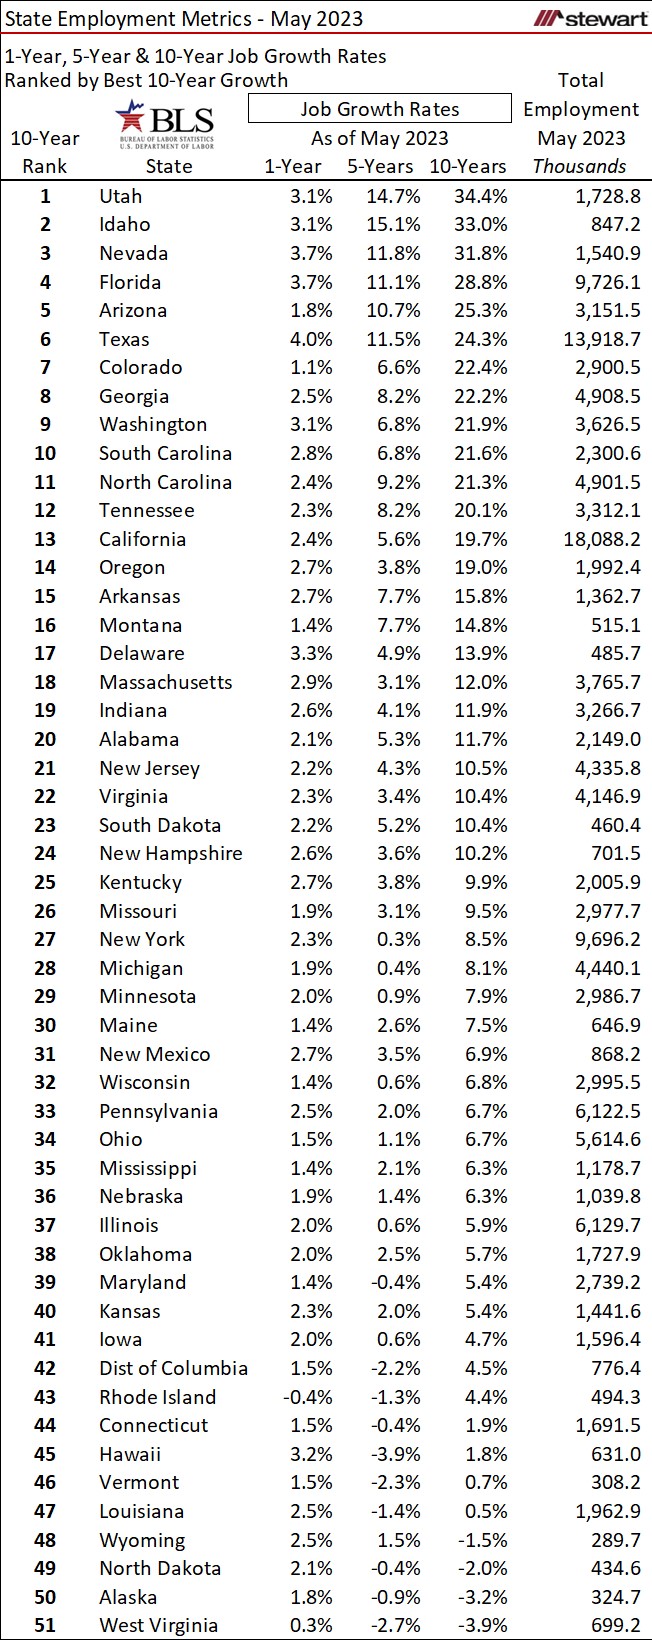
The last table shows state job growth rates for the past one, five, and 10 years, sorted by percentage gain over 10 years. Long-run job growth shows which state economies continue to perform well across the economic cycle and which are struggling. Just four states failed to gain jobs in the past 10 years:
-3.9% West Virginia
-3.2% Alaska
-2.0% North Dakota
-1.5% Wyoming
The BLS provides a plethora of job- and workforce-related data monthly ranging from county to national levels. These data can be accessed at www.bls.gov, then click the DATA TOOLS tab.
Jobs are everything to the economy. Period.
It’s all about jobs.
Ted