
Housing Affordability in 2026: Prices Blinked. Rates Didn't.

Key Highlights
- Rates climbed almost all year. The 30-year fixed rate averaged 6.05% in February and 7.33% in October, according to Freddie Mac.
- Prices peaked in June (no surprise there). The median existing-home price hit $442,800 in June, then slid to $417,500 in September, according to the National Association of Realtors.
- The price drop barely moved the payment. In our example, a buyer at the June peak paid about $2,516 a month. A buyer in September paid about $2,465. A $25,300 price cut saved about $51 a month.
- Same price, bigger bill. The median price was $417,500 in both April and September. Based on our math, the monthly payment still rose about $132 because of higher rates.
- Owning a home took a bigger bite. Owning a typical home took 44% of median income in September, according to the Federal Reserve Bank of Atlanta. The Atlanta Fed calls anything above 30% unaffordable.
- Buyers adapted. Mortgage applications rose 2.7% in October, and ARMs made up 11.3% of applications, up from 7.6% in June, according to the Mortgage Bankers Association.
- The big takeaway: Based on the latest data, the mortgage rate may matter more than the price tag right now.
Payment examples assume a 30-year fixed loan with 10% down. They cover principal and interest only, not taxes or insurance. They are illustrations, not quotes.
Article Overview
Jump to the section relevant to you.
Buyers: How much home can you actually carry right now?
Lenders: What do these numbers mean for your pipeline?
Real estate agents: Which deals may be most likely to wobble?
Relocation teams: What might a move package need to cover now?
Builders: What kind of home may fit today’s buyer budget?
Investors: Who may become your next tenant?
FAQs about 2026 housing affordability
What happened to housing affordability in 2026?
The year started with a small break. Mortgage rates averaged 6.10% in January and dipped to 6.05% in February, according to Freddie Mac. That was the low point for the year.
Then the climb began. Rates rose every month after February and reached a 7.33% average in October. That’s 1.28 percentage points higher in eight months.
Prices did the opposite, though later in the year. The median existing-home price rose from $395,000 in January to $442,800 in June, according to NAR. Then it fell three months in a row and landed at $417,500 in September.
The Atlanta Fed’s numbers back this up. Its affordability index fell from 74 in March to 68 in September. A score of 100 or higher counts as affordable, so 68 suggests a real stretch for a typical household.
Housing affordability, January-October 2026
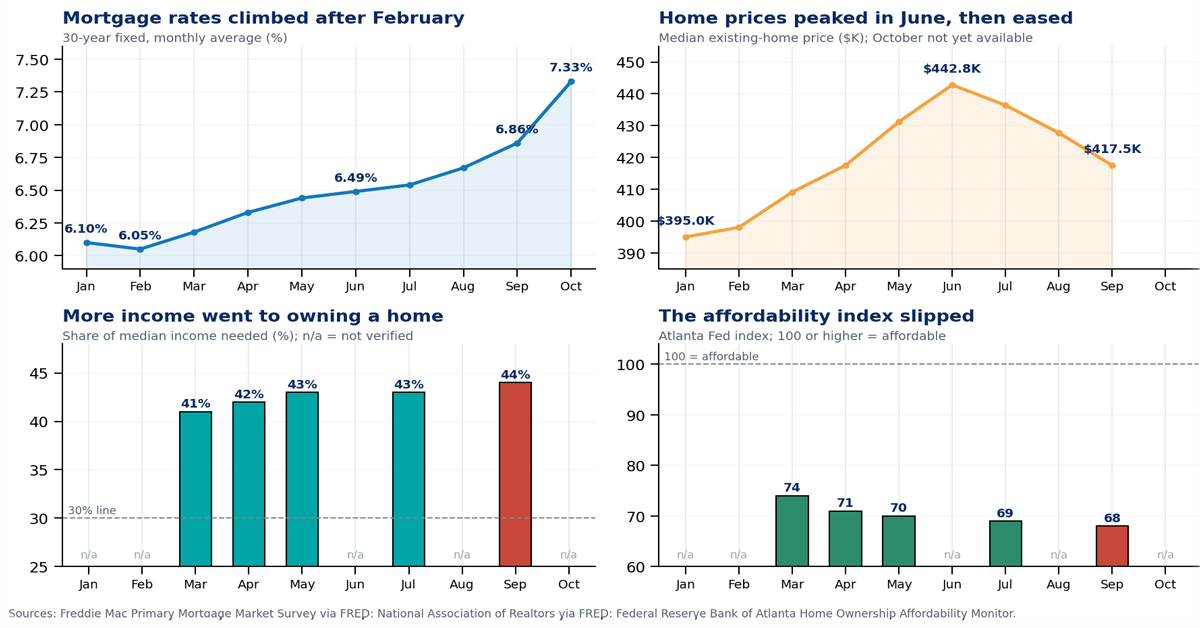
Chart: Housing affordability, January–October 2026. Sources: Freddie Mac, National Association of Realtors, Federal Reserve Bank of Atlanta.
Bottom line: the year may be remembered less for prices and more for rates.
Buyers: How much home can you actually carry right now?
The short answer: probably less than the listing price suggests.
Here’s the math that matters. In April, a $417,500 home at that month’s 6.33% average rate came to about $2,333 a month in principal and interest. In September, the same price at 6.86% came to about $2,465. At October’s 7.33% average, it would be about $2,584.
That’s about $250 more a month for the same house, or roughly $3,000 a year. That could cover a car payment, a child-care bill or a few months of groceries.
The Atlanta Fed adds more context. Ownership costs took 44% of median income in September, up from 41% in March. When almost half the paycheck goes to the house, there may be little left for repairs, insurance bumps or surprises.
What this may mean for you: Start with the monthly payment you can live with, then work back to a price. A lower price may help, but it may not be enough on its own.
Your next move: Get your full monthly cost, including taxes, insurance and cash to close, before you start touring homes.
Learn more about the best time to buy a home
Lenders: What do these numbers mean for your pipeline?
Short answer: Buyers are still applying, but they may be shopping differently.
Rates kept climbing all year, but demand didn’t disappear. The number of mortgage applications rose 2.7% in October, according to the Mortgage Bankers Association. Buyers who still need to move may be finding a way to make the numbers work.
One way they may be doing it is with adjustable-rate loans. ARMs made up 11.3% of applications in October, according to the Mortgage Bankers Association (MBA). That’s up from 7.6% in June. ARMs also accounted for 25% of loan dollars in October, which suggests that buyers with larger loans may be more willing to take on rate risk to lower their starting payment. The MBA’s five-year ARM rate was 6.41%, compared with a 6.86% monthly average for a 30-year fixed loan.
Refinancing has mostly stalled. The MBA refinance index fell from a peak of 1,637.5 earlier this year to 516.8 in October. Fannie Mae’s rate-and-term refinance index was down 83.8% from a year ago. Many homeowners still have loans below 5%, so they may have little reason to refinance at today’s rates.
Purchase activity is still behind last year’s pace. Fannie Mae’s purchase application index was down 19% from a year earlier, even after a 1.3% weekly gain.
Lenders may also be adding a cushion to their pricing. The gap between the 30-year mortgage rate and the 10-year Treasury yield was 2.04 percentage points in late October, based on Federal Reserve data. A gap above 2 points often means lenders are pricing in more risk. The ICE BofA MOVE index, which tracks bond market swings and volatility, hit 100.20 on Oct. 30. That’s well above the normal 50 to 75 range.
Forecasters don’t see quick relief. Fannie Mae projects a 7.4% average 30-year rate in the fourth quarter, and the MBA projects 7.3%. Forecasts can change, but these suggest higher rates may be part of planning for now.
What this may mean for you: Your pipeline may tilt more toward purchase loans, ARM conversations and borrowers who need help making the payment work.
Your next move: Recheck debt-to-income on older pre-approvals, explain ARM tradeoffs clearly and talk through rate-lock timing early.
Integrate seamless workflows into your lending services with Stewart Lender Solutions.
Real estate agents: Which deals may be most likely to wobble?
Watch the buyers who got pre-approved in the spring.
A buyer approved in April at a 6.33% average rate may have faced 6.86% by September and 7.33% in October. Based on our example, that’s a payment jump of about $132 to $251 a month on a median-priced home.
For a buyer already near the Atlanta Fed’s 44% income share, that gap could break a deal. A low appraisal, a repair request or a higher closing cost could also tip a tight budget.
The upside is that prices eased after June. Sellers who listed at summer prices may have more room to negotiate, and that could help close the gap.
What this may mean for you: The riskiest deals may be the ones that looked fine on paper months ago.
Your next move: Recheck the payment, cash to close and loan terms early, before the deal gets to the closing table.
Relocation teams: What might a move package need to cover now?
A lower home price may not mean a smaller package.
The September median price of $417,500 matched April’s exactly, according to NAR. But in our example, the monthly payment on that price rose about $132 between those months because of higher rates.
Employees moving this fall may face higher monthly costs than employees who moved in the spring, even when the home prices look the same. Ownership costs took 44% of median income in September, according to the Atlanta Fed. That may leave transferees with less room for temporary housing, closing costs or overlapping payments.
What this may mean for you: Packages built on spring numbers may come up short for fall moves.
Your next move: Refresh your cost model with current rates and look at the employee and the destination together.
Make transferee moves easier and potentially increase retention by streamlining services with Stewart Relocation Services.
Builders: What kind of home may fit today’s buyer budget?
Today’s buyer is likely shopping by monthly payment.
The median price peaked at $442,800 in June and fell to $417,500 by September, according to NAR. Over the same months, rates kept rising. Buyers may now judge a home by its monthly cost first and its features second.
With a 44% income share and an affordability index of 68 in September, according to the Atlanta Fed, many buyers may be stretched. That may favor smaller floor plans, simpler finishes or price points tied to a target payment.
What this may mean for you: The best-selling home may be the one that fits a monthly budget, not the one with the longest feature list.
Your next move: Compare your local sales by price range and home size to see where buyers are actually landing.
Investors: Who may become your next tenant?
The same numbers that squeeze buyers may widen the renter pool.
Buyers see a tighter budget, and investors may see demand. When owning a typical home takes 44% of median income, as the Atlanta Fed reported for September, some would-be buyers may decide to rent a little longer.
That group could include households that might have bought last year. These may be renters with steady jobs, good credit and solid incomes who are waiting for a better rate. Rates averaged 7.33% in October, according to Freddie Mac, the highest monthly average this year.
The affordability index of 68 points the same way. Many households may not be able to afford the median home under the Atlanta Fed model, and some of them may look to rent instead.
What this may mean for you: Your next tenant may look a lot like last year’s buyer.
Your next move: Check local rents, vacancy and lease-up times to see if this pattern is showing up in your market.
Frequently asked questions about 2026 housing affordability
The average 30-year fixed rate was 6.10% in January and dipped to 6.05% in February, according to Freddie Mac. It rose every month after that and averaged 7.33% in October.
The median existing-home price was $395,000 in January, peaked at $442,800 in June and eased to $417,500 in September, according to the National Association of Realtors.
Rates rose while prices fell. In our example, a $25,300 price drop from June to September cut the monthly payment by only about $51.
Mortgage applications rose 2.7% in October, and adjustable-rate loans made up 11.3% of applications, up from 7.6% in June, according to the Mortgage Bankers Association.
The Atlanta Fed uses 100 as the line for affordable. A score of 68 in September 2026 suggests a typical household may struggle to afford a typical home.
No. National numbers are a starting point. Local prices, rents, wages, taxes and inventory may tell a different story.
This article is for general information only. It is not financial, legal, tax, lending or investment advice.
Sources
- Freddie Mac Primary Mortgage Market Survey, via FRED
- National Association of Realtors, Existing-Home Sales
- Federal Reserve Bank of Atlanta, Home Ownership Affordability Monitor
- Mortgage Bankers Association, Weekly Applications Survey
- Fannie Mae, Economic and Strategic Research
- Federal Reserve Bank of St. Louis, FRED (10-year Treasury, DGS10)